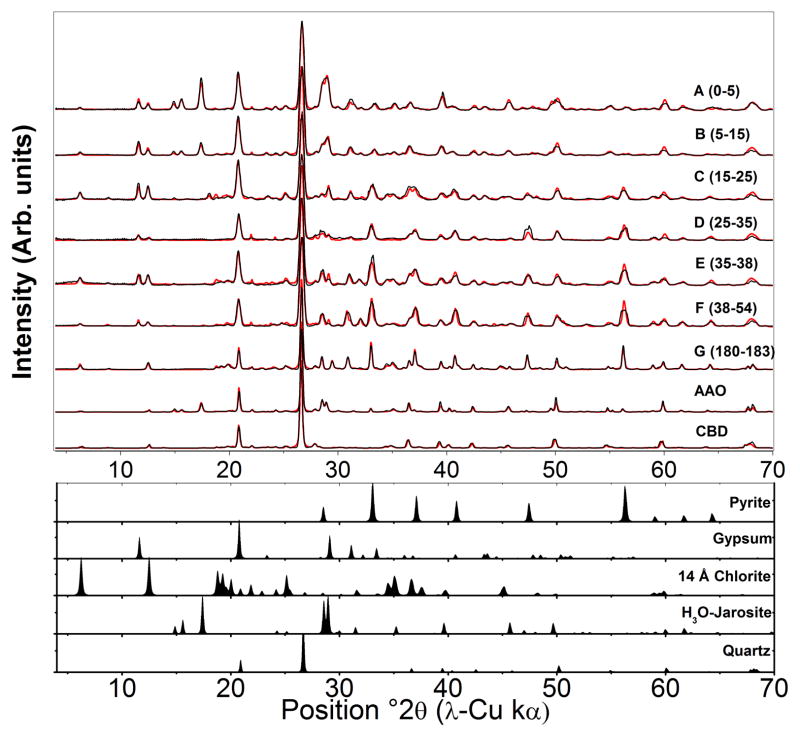
Figure 3.
X-ray diffraction data and fits. Synchrotron transmission XRD patterns (black lines) converted to Cu Kα scale of IKMHSS pit samples at depths A–G and SSE samples, with corresponding Rietveld models (gray lines). Lower diffractograms represent the simulated patterns of selected phases used in the Rietveld models. Data are normalized to quartz. All jarosite group minerals (e.g., plumbojarosite, hydronium jarosite, jarosite) are modeled here using jarosite. Quantitative results are displayed in Table 4.

