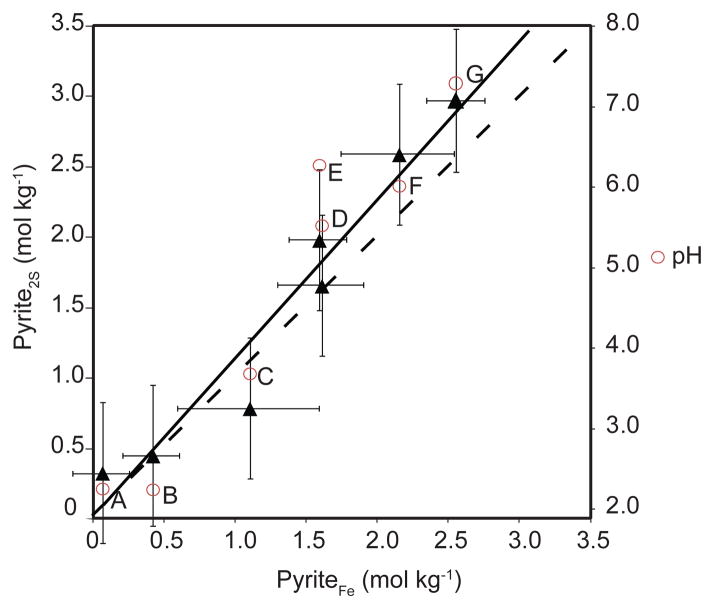
Figure 6.
Comparison of apparent pyrite concentration from linear combination fits to S XANES and Fe XANES. Moles of pyrite per kg of tailings were calculated from the pyrite fractional fit from Fe and S XANES spectra and the moles of Fe and S in the tailings respectively. The solid line is the linear correlation (r2= 0.944), the dashed line is the Fe:2S line, accounting for stoichiometry of FeS2. Error bars are from the calculated error estimates from the S and Fe fits and not from replicate spectra. The pH is shown in circles for each associated sample.

