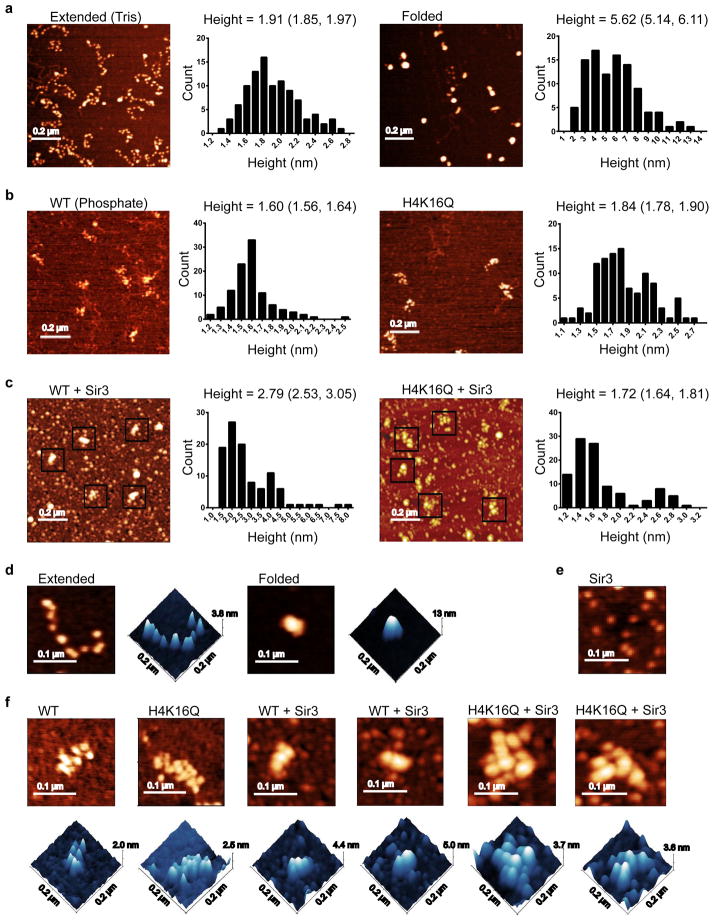
Figure 5. Sir3 heterochromatin arrays are less compact than 30 nm fibers.
(a) AFM images and height measurements of arrays in Tris (extended) and in Tris with 1 mM MgCl2 (folded). The mean heights and 95% confidence intervals are shown above the height histograms. (b) Images and height histograms as in (a) of WT and H4-K16Q arrays in phosphate buffer. (c) Images and height histograms as in (a) of WT and H4-K16Q arrays in phosphate buffer with Sir3. Structures in black boxes are arrays bound or unbound by Sir3. (d) Representative, detailed 2D and 3D images of extended and folded arrays in low salt Tris buffer. (e) Representative, detailed image of Sir3 protein alone. (f) Representative, detailed 2D and 3D images of WT and H4-K16Q arrays in phosphate +/− Sir3. Note that AFM heights are generally less than crystallographic values (but proportional to them) because of sample compression, adsorption of ions and small molecules on the substrate adjacent to the complexes being measured and chemical interactions between the probe and molecules.

