Figure 3.

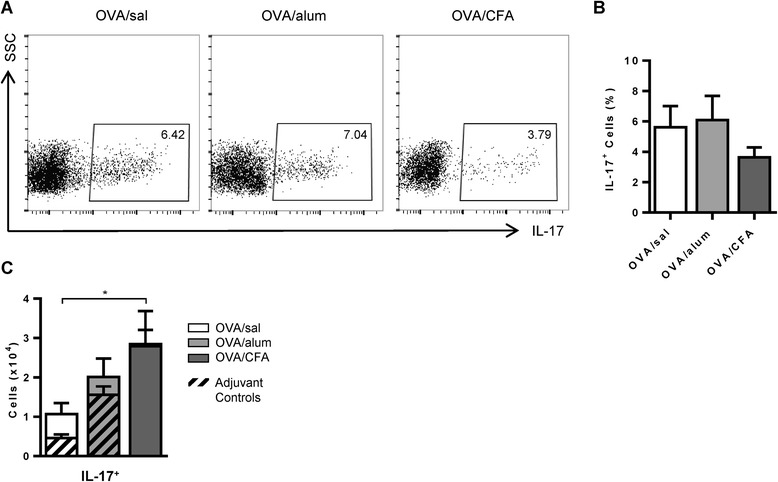
IL-17 expressing cells are present in the BAL fluid of all OVA sensitized and challenged mice. Cells were stimulated with PMA/ionomycin and stained to detect IL-17. (A) Representative flow cytometry plots are shown. (B) The frequencies of IL-17 expressing cells for the OVA groups are shown. One-way ANOVA, Holm-Sidak. (C) The total number of IL-17 expressing cells are shown for OVA groups. Two-way ANOVA, Holm-Sidak. Mean values (+SEM) from 7–11 total mice per group, from 2 independent experiments. (B-C) *p < 0.05 comparisons between OVA groups.
