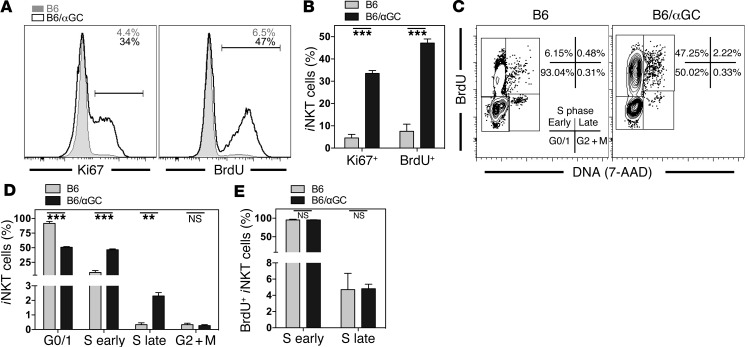
Figure 1. αGalCer-pretreated iNKT cells display an increased frequency of proliferating cells.
(A and B) Steady-state expression of Ki67 and BrdU (3-day pulse) in splenic iNKT cells from C57BL/6 control (B6, tinted area) or C57BL/6 mice injected 1 month earlier with 4 μg αGalCer (B6/αGC, black line). Representative data (A) and a summary graph (B) are shown. Numbers in the histograms denote the percentage of positive cells within the depicted gate from the indicated mice. (C–E) Expression of DNA (labeled with 7-AAD) and BrdU (3-day pulse) in splenic iNKT cells from C57BL/6 control (B6) or C57BL/6 mice injected 1 month earlier with 4 μg αGalCer (B6/αGC). Representative data (C) and a summary graph (D) are shown. Numbers in C denote the percentages in the respective rectangles. Definition of the cell-cycle stages is given in the left dot plot. M, mitosis. (E) Graphic representation of the frequency of 7-AAD– (S early) and 7-AAD+ (S late) cells, considering BrdU+ iNKT cells. Representative data from at least 3 independent experiments (3–4 mice/group) are shown for each panel.

