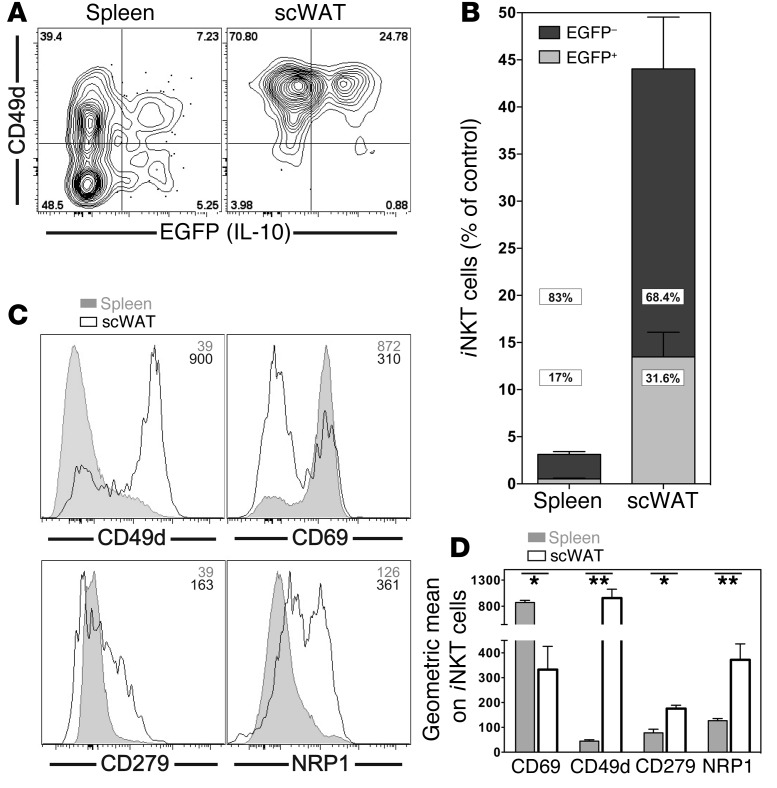
Figure 10. NKT10 cells are enriched in WAT.
(A and B) Il10GFP mice were left untreated or were i.v. injected with 1 μg αGalCer, and iNKT cells in spleen and scWAT were analyzed 16 hours later. (A) Expression of EGFP and CD49d from 1 representative experiment. Numbers in the dot plots denote the percentage of cells in the respective quadrants. (B) Percentage of EGFP+ (light gray) and EGFP– (dark gray) iNKT cells from spleen and scWAT was calculated as the percentage of iNKT cells in untreated control mice. P < 0.001 for spleen versus scWAT for all comparisons. Graph summarizes data from 4 independent experiments with 13 mice per group. (C and D) iNKT cells from spleen and scWAT of C57BL/6 mice were analyzed for expression of the indicated markers. Representative data (C) and a summary graph (D) are shown. Numbers in the histograms in C denote the geometric mean values for the depicted antigens on iNKT cells. Representative data from 1 of at least 3 independent experiments are shown.

