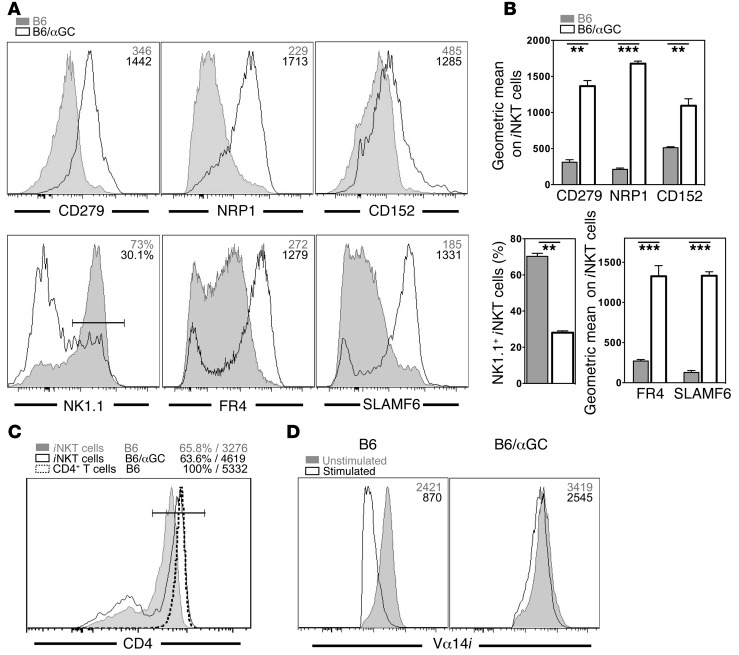
Figure 5. The phenotype of αGalCer-pretreated iNKT cells is similar to that of Tregs.
(A and B) Splenic iNKT cells from C57BL/6 control (B6) or C57BL/6 mice injected 1 month earlier with 4 μg αGalCer (B6/αGC) were stained for the indicated surface proteins. Representative data (A) and summary graphs (B) are shown. Numbers in the histograms denote either the geometric mean values or the percentage of positive cells within the depicted gate for the indicated antigens on iNKT cells from mice treated as shown. (C) Expression of CD4 on iNKT cells and CD4+ T cells from spleens from control B6 or B6/αGC mice. Numbers denote the percentage of CD4+ cells (left) and the geometric mean values for CD4 (right) on the cells within the gate depicted in the histogram. (D) Control B6 or B6/αGC mice were either left untreated (Unstimulated) or i.v. injected with 1 μg αGalCer (Stimulated), and the expression of Vα14i TCR was measured on splenic iNKT cells with CD1d-αGalCer tetramers 16 hours later. Numbers in the histograms denote the geometric mean values for the indicated antigens on iNKT cells from mice treated as shown. Summary data for C and D are provided in Supplemental Figure 4, A and B, respectively. Representative data from at least 3 independent experiments are shown in each panel.

