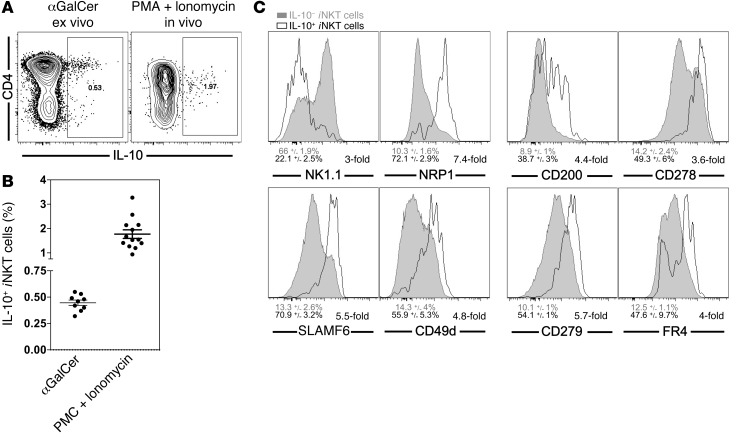
Figure 9. A subset of untreated Vα14i NKT cells express IL-10.
(A and B) C57BL/6 mice were left untreated or were injected with 1 μg αGalCer, and 90 minutes later, splenocytes were purified and incubated for 2 hours in vitro in the presence of protein transport inhibitors before iNKT cells were analyzed (αGalCer). Alternatively, splenocytes were stimulated with PMA and ionomycin in vitro for 4 hours (PMA + ionomycin). Representative data (A) and a summary graph (B) are shown. Data in B are summarized from at least 4 independent experiments with at least 9 mice per group. αGalCer = mean: 0.45% ± 0.03%; median: 0.46%. PMA + ionomycin = mean: 1.77% ± 0.18%; median: 1.55%. Numbers in the dot plots denote the percentage of cells in the respective rectangle. Gating is based on 0% of IL-10+ cells in unstimulated C57BL/6 iNKT cells. Similar background values were obtained with isotype control antibody or by staining of stimulated Il10–/– iNKT cells (Supplemental Figure 8). (C) Splenocytes from C57BL/6 mice were stimulated with PMA and ionomycin as described in A, and iNKT cells were stained for IL-10 and the indicated markers. Histograms depict the overlay of IL-10– (gray) and IL-10+ (black) iNKT cells for the indicated markers. Numbers below the graphs represent either the average expression of the indicated marker on IL-10– (gray) and IL-10+ (black) iNKT cells (left), or the fold difference between both of these values (right). All differences were statistically significant (P < 0.01). Data shown are representative of 3 to 6 independent experiments.

