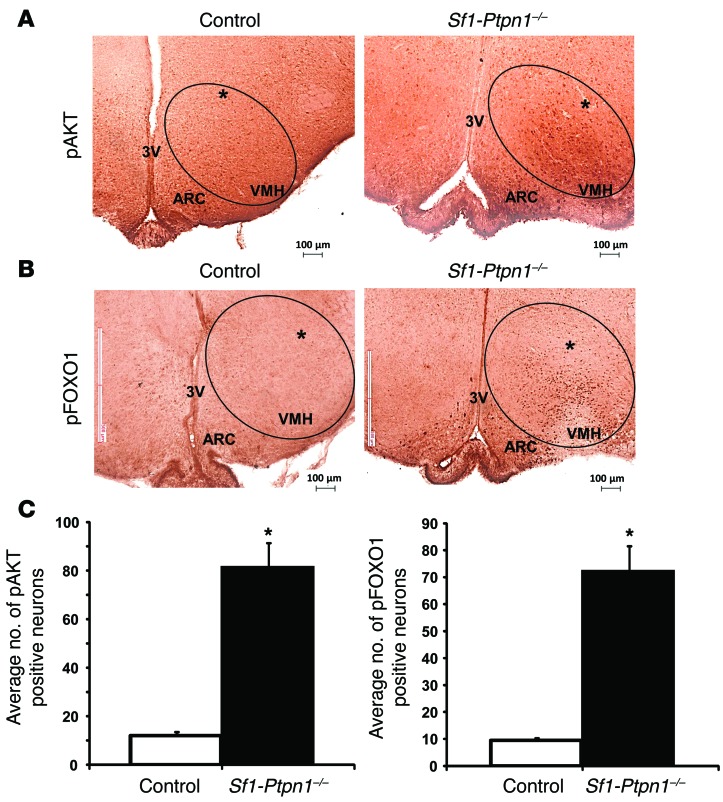
Figure 8. Increased insulin response in VMH of Sf1-Ptpn1–/– mice on HFD.
(A) pAKT and (B) pFOXO1 immunostaining following injection of insulin (4 μU/μl in aCSF) into the VMH. Asterisk indicates location of cannula. (C) The numbers of pAKT- and pFOXO1-positive neurons were quantified in 3 to 6 slices per brain from 3 different brains per genotype, injected with either aCSF or insulin unilaterally in the VMH. Neither aCSF-injected nor uninjected VMH showed significant staining (data not shown). Bars represent means ± SEM; *P < 0.05, unpaired t test. Circles indicate VMH. Scale bars: 100 μm. Original magnification: ×10 (A and B).

