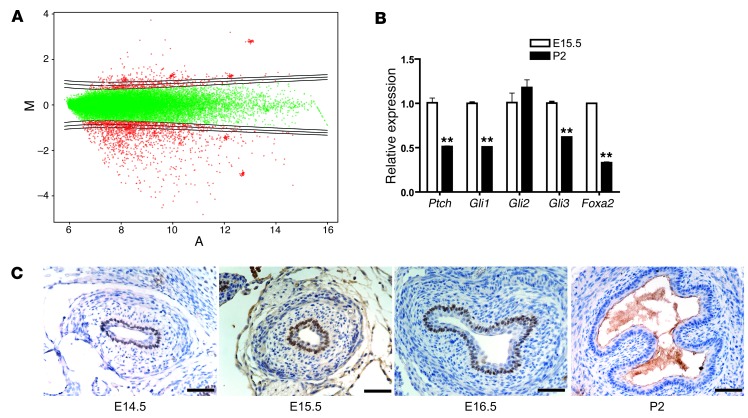
Figure 2. Microarray analysis identifies Foxa2.
(A) MvA plot of E15.5 esophagi versus P2 esophagi microarray experiment. (B) Validation of microarray results with qRT-PCR for Hh pathway/target genes and Foxa2. **P < 0.01 as compared with E15.5. (C) FOXA2 immunohistochemistry of E14.5 to E16.5 esophagus and P2 esophagus. Scale bars: 50 μm.

