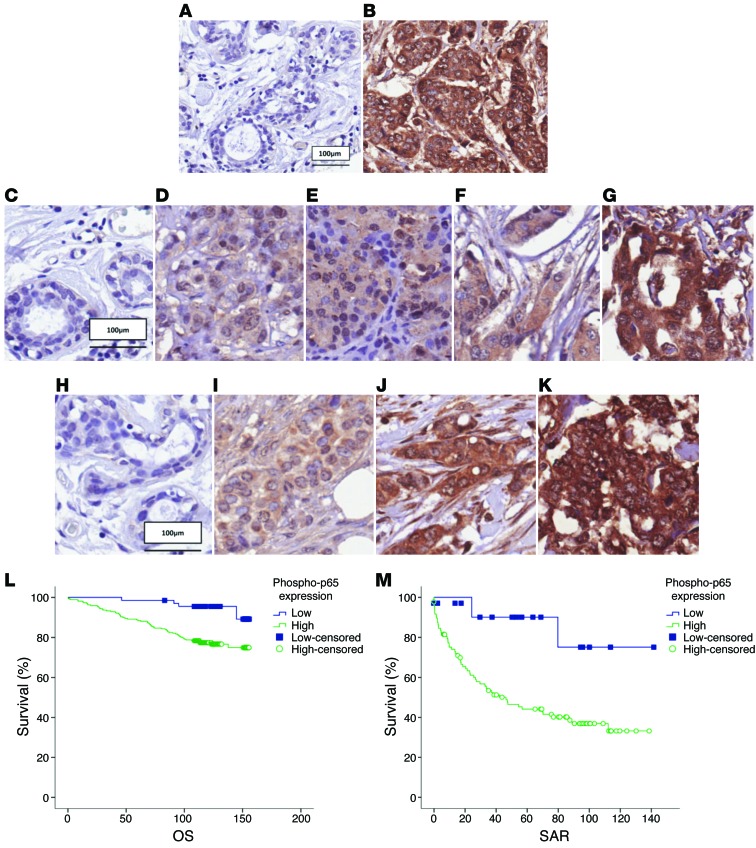
Figure 5. Expression of active p65 (phospho-p65, Ser276) has a prognostic value.
Staining of phospho-p65 (Ser276) in (A) normal ductal tissue and (B) IDC. Representative staining of phospho-p65 (Ser276) in (C) normal ductal tissue, (D) luminal A subtype, (E) luminal B subtype, (F) HER2 subtype, and (G) basal subtype. Phospho-p65 (Ser276) staining in (H) normal nonmalignant ductal tissue, (I) low-grade IDC, (J) IDC grade 2, and (K) IDC grade 3. Cell nuclei were counterstained with hematoxylin. (L) Kaplan-Meier curves showing phospho-p65 (Ser276) expression in relation to OS. Cases that have not experienced a positive event are censored at the date of last follow-up (small vertical lines on the line plots). (M) Kaplan-Meier curves showing phospho-p65 (Ser276) expression in relation to SAR. Cases that have not experienced a positive event are censored at the date of last follow-up (small vertical lines on the line plots).

