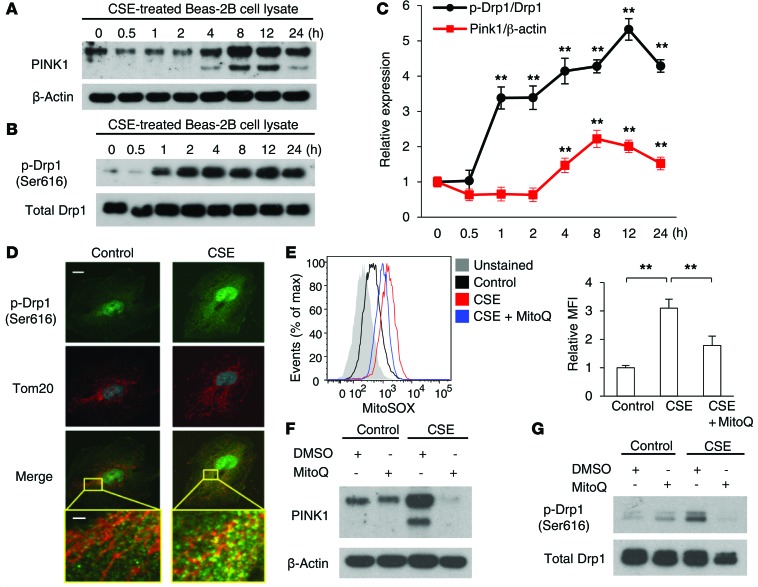
Figure 2. CSE induces PINK1 expression and phosphorylation of Drp1 (Ser616), which is regulated by mitochondrial ROS.
Immunoblot analysis of PINK1 (A) and p-Drp1 (B) in cell lysates from Beas-2B cells treated with 20% CSE at the indicated times. β-Actin and total Drp1 served as the standards. (C) p-Drp1 and PINK1 expression was assessed by densitometry of immunoblots. Band intensities were normalized to total Drp1 and β-actin. Data are representative of 3 experiments. (D) Immunofluorescence staining for p-Drp1 (green), Tom20 (red), and nuclei (blue) in Beas-2B cells treated with 20% CSE for 1 hour. Scale bar: 10 μm. Areas outlined in yellow are shown enlarged in the bottom panels (scale bar: 2 μm). Image (original magnification, ×120) is representative of 5 images/slide; n = 3 slides/condition. (E) Flow cytometry of Beas-2B cells labeled with MitoSOX. Beas-2B cells were incubated for 1 hour with MitoQ (10 μM) or vehicle (DMSO) and treated with 20% CSE for 4 hours. The x axis shows the fluorescent signal intensity, and the y axis represents the cell number normalized as a percentage of the maximum (% of max). Data are representative of 3 experiments. Immunoblot analysis of PINK1 (F) and p-Drp1 (G). Beas-2B cells were incubated for 1 hour with MitoQ (50 μM) or vehicle (DMSO) and treated with 20% CSE for 8 hours. β-Actin and total Drp1 served as the standards. All data represent the mean ± SEM (C and E). **P < 0.01 by unpaired, 2-tailed Student’s t test (C and E) versus control (C).

