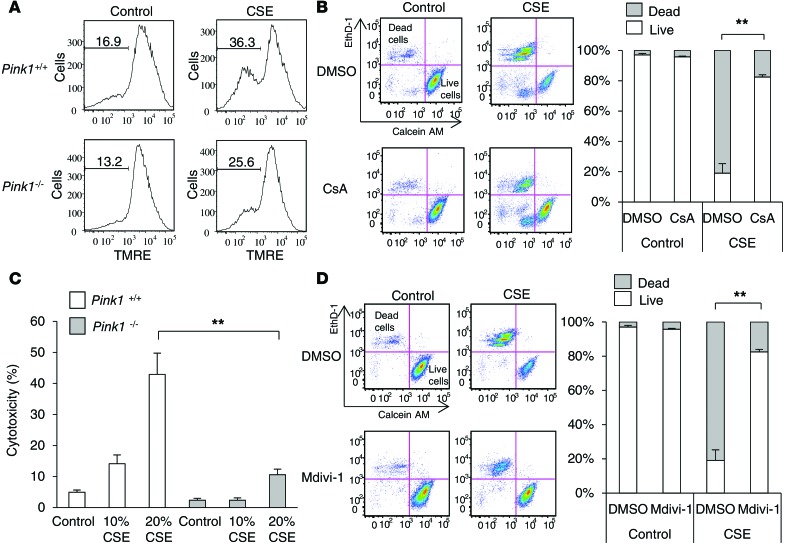
Figure 5. CSE-induced mitophagy decreases ΔΨm, leading to cell death in pulmonary epithelial cells.
(A) Flow cytometry of alveolar epithelial cells obtained from Pink1–/– and Pink1+/+ mice. Alveolar epithelial cells were treated with 20% CSE for 4 hours and labeled with TMRE. The x axis shows the fluorescent signal intensity of TMRE, and the y axis shows the cell number with corresponding fluorescence intensity. Numbers above bracketed lines indicate the percentage of cells with loss of mitochondrial membrane potential. Data are representative of 2 experiments. (B) Beas-2B cells were incubated for 1 hour with CsA (10 μM) or vehicle (DMSO) and treated with 20% CSE for 15 hours. Cell death was determined by calcein AM/EthD-1 flow cytometry. The x axes show calcein AM staining, and the y axes show EthD-1 staining (B and D). Data are representative of 3 independent experiments. (C) Alveolar epithelial cells were obtained from Pink1–/– and Pink+/+ mice. Alveolar epithelial cells were treated with 10% or 20% CSE for 15 hours. Cytotoxicity was measured by LDH release. Data are representative of 2 experiments. (D) Beas-2B cells were incubated for 3 hours with Mdivi-1 (50 μM) or vehicle (DMSO) and treated with 20% CSE for 15 hours. Cell death was determined by calcein AM/EthD-1 flow cytometry. Data are representative of 3 experiments. Data represent the mean ± SEM (B–D). **P < 0.01 by unpaired, 2-tailed Student’s t test (B–D).

