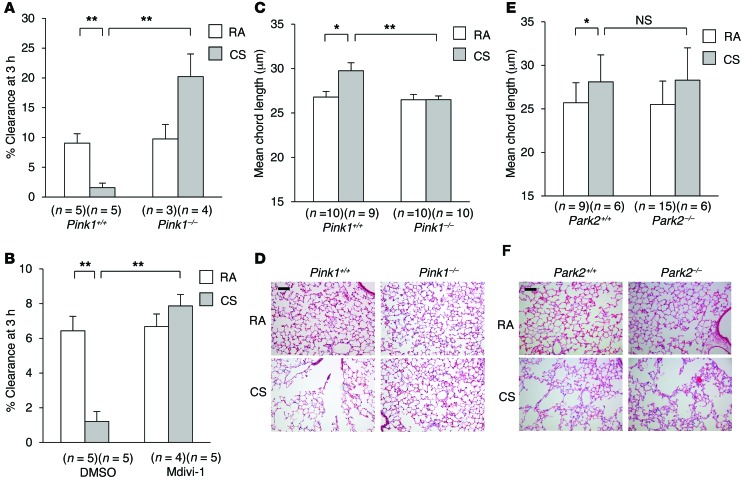
Figure 8. Mitophagy contributes to disruption of airway function and airspace enlargement during CS exposure in vivo.
(A) MCC was assessed at 3 hours in Pink1+/+ and Pink1–/– mice following exposure to RA or CS for 3 weeks. (B) MCC was assessed at 3 hours in mice i.p. injected with 50 mg/kg Mdivi-1 or vehicle (DMSO) 1 hour prior to exposure to CS Mice were exposed to RA or CS for 3 weeks. (C–F) Mice were exposed to RA or CS for 6 months. Chord lengths were measured in Pink1+/+ and Pink1–/– mouse lungs (C) or in Park2+/+ and Park2–/– mouse lungs (E). Chord lengths in Pink1+/+ and Pink1–/– mouse lungs were calculated from a total of 2 independent CS exposure experiments. Representative images (original magnification, ×200) of Pink1+/+ and Pink1–/– mouse lungs (D) or of Park2+/+ and Park2–/– mouse lungs (F) are shown with modified H&E staining. Scale bar: 50 μm. Image is representative of 5 images/mouse; n = 3 mice/group. All data represent the mean ± SEM (A–C and E). *P < 0.05 and **P < 0.01 by 2-way ANOVA with Bonferroni’s post tests (A–C and E).

