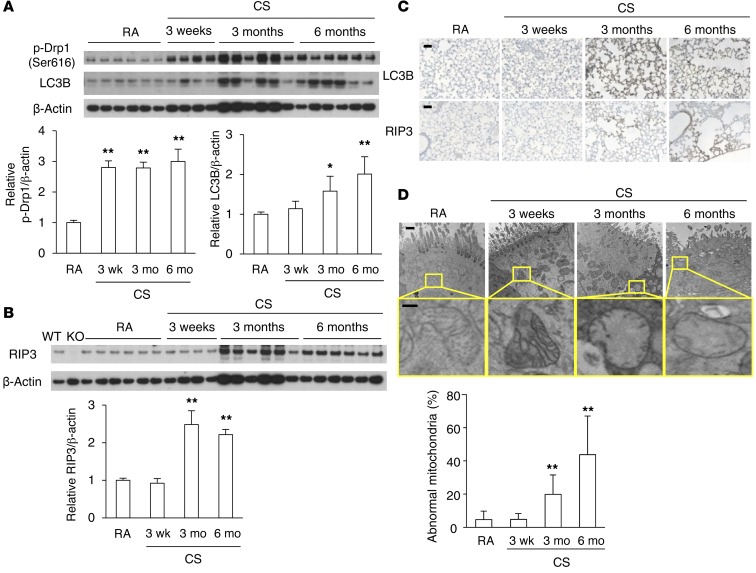
Figure 9. Mitophagy and necroptosis factors can be detected in mouse lung sections of the CS-exposure model.
(A and B) Immunoblot analysis of p-Drp1 (Ser616), LC3B, and RIP3 from mouse lung homogenate samples following exposure to RA or CS for 3 weeks, 3 months, and 6 months. β-Actin served as the standard. p-Drp1 (Ser616), LC3B, and RIP3 expression was assessed by densitometry of immunoblots. Band intensities were normalized to β-actin. n = 4 or 6 samples/group. WT: Ripk3+/+; KO: Ripk3–/–. (C) Mouse lung sections following exposure to RA or CS for 3 weeks, 3 months, and 6 months were immunostained for LC3B or RIP3. Scale bar: 50 μm. Image (original magnification, ×200) is representative of 5 images/mouse; n = 4 mice/group. (D) Representative TEM images of mouse lung sections exposed to RA or CS for 3 weeks, 3 months, and 6 months. Scale bar: 500 nm. Mitochondria in yellow-outlined areas are shown enlarged in lower panels (scale bar: 100 nm). 10–20 images/treatment group; n = 1–3 mice/group. Histograms show quantification of abnormal mitochondria. Data were normalized to the RA control group for each time point. All data represent the mean ± SEM (A, B, and D). *P < 0.05 and **P < 0.01 versus control by unpaired, 2-tailed Student’s t test (A and B) and 1-way ANOVA with Bonferroni’s post tests (D).

