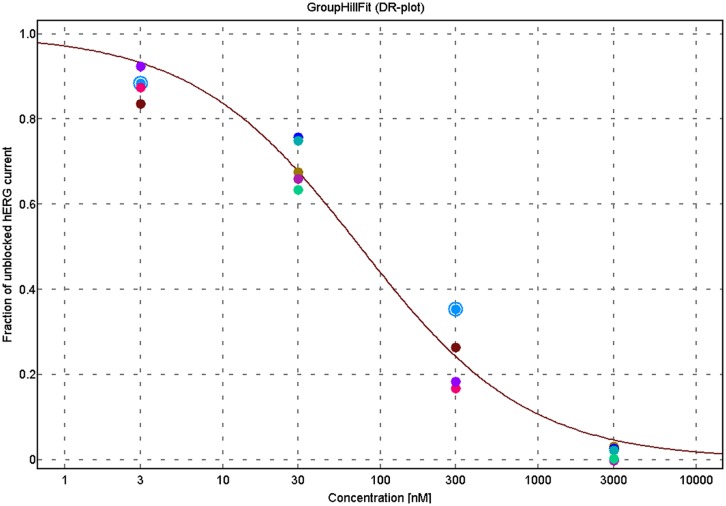
FIGURE 3.
Dose-response fit through the data of nine cells (each identified by a unique color) with two concentrations of Terfenadine applied to each cell. For each cell, hERG tail current values representative for each compound concentration where determined as shown in Figure 3, and normalized to the unblocked hERG current value which was recorded at the end of the saline period before the first compound application. The combined data of all nine cells was then fitted to the hill equation y = ch/(IC50h+ch) to estimate the half maximal inhibition concentration (IC50 value) and hill coefficient h for this compound (IC50 = 72 nM, h = 0.8).

