
Figure 1.
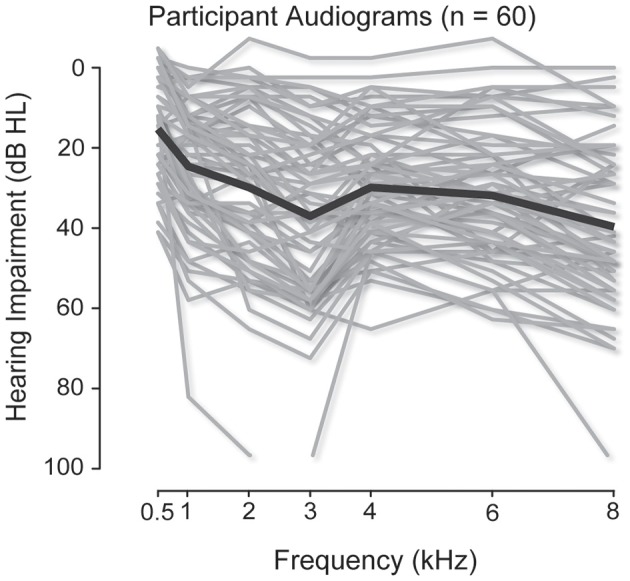
Audiograms for the participants. The individual audiograms, measured at 500, 1000, 2000, 3000, 4000, 6000, and 8000 Hz, of all listeners are plotted in gray. The mean audiograms are plotted as solid black lines.
Official websites use .gov
A
.gov website belongs to an official
government organization in the United States.
Secure .gov websites use HTTPS
A lock (
) or https:// means you've safely
connected to the .gov website. Share sensitive
information only on official, secure websites.
Audiograms for the participants. The individual audiograms, measured at 500, 1000, 2000, 3000, 4000, 6000, and 8000 Hz, of all listeners are plotted in gray. The mean audiograms are plotted as solid black lines.