Figure 1.

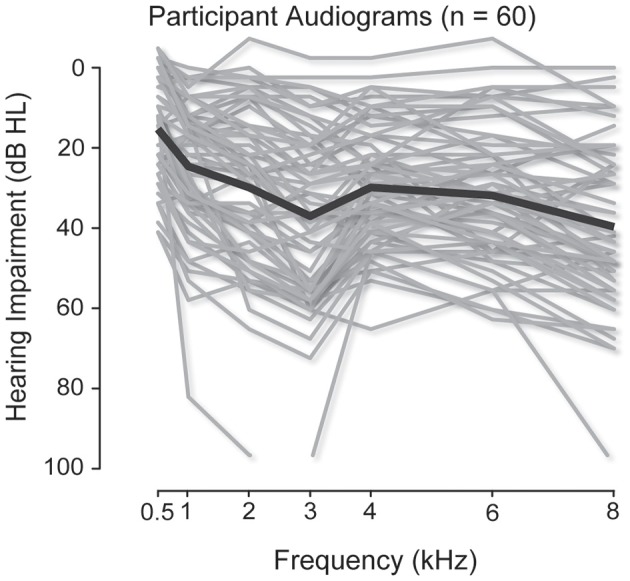
Audiograms for the participants. The individual audiograms, measured at 500, 1000, 2000, 3000, 4000, 6000, and 8000 Hz, of all listeners are plotted in gray. The mean audiograms are plotted as solid black lines.

Audiograms for the participants. The individual audiograms, measured at 500, 1000, 2000, 3000, 4000, 6000, and 8000 Hz, of all listeners are plotted in gray. The mean audiograms are plotted as solid black lines.