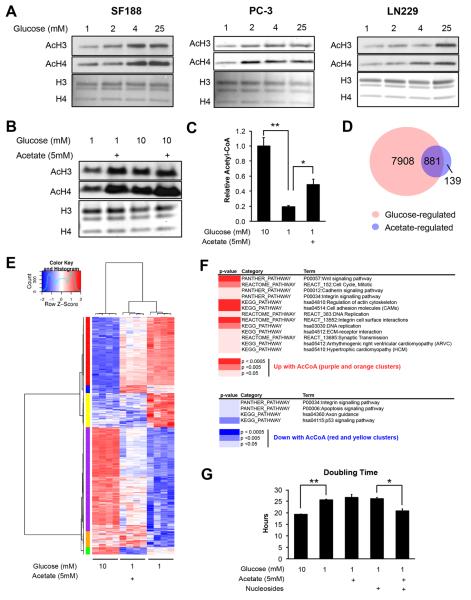
Figure 1. Glucose availability regulates histone acetylation in several cancer cell lines.
(A) Acetylation of acid-extracted histones from cells cultured under indicated glucose conditions for 24 hours. Total histones were stained by Coomassie or Ponceau. (B) Acetylation of acid extracted histones from LN229 cells treated with 1 or 10 mM glucose, +/− 5 mM NaOAc for 24 hours (C) Relative levels of acetyl-CoA in LN229 cells after 24 hours of indicated treatment, mean +/− SEM of triplicates (*, p<0.05; **, p<0.005) (D) Venn diagram of genes regulated by glucose and/or acetate in LN229 cells, with the overlap representing genes designated as acetyl-CoA-regulated (E) Heatmap of 881 genes represented in the overlap from the Venn diagram. See Table S3 for associated gene list and cluster ID. (F) DAVID functional annotation of pathways regulated by acetyl-CoA, using the gene list identified from the indicated clusters on the heatmap. (G) Doubling time for LN229 cells treated as indicated for 24 hours, mean +/− SEM of triplicates (*, p<0.05; **, p<0.005).

