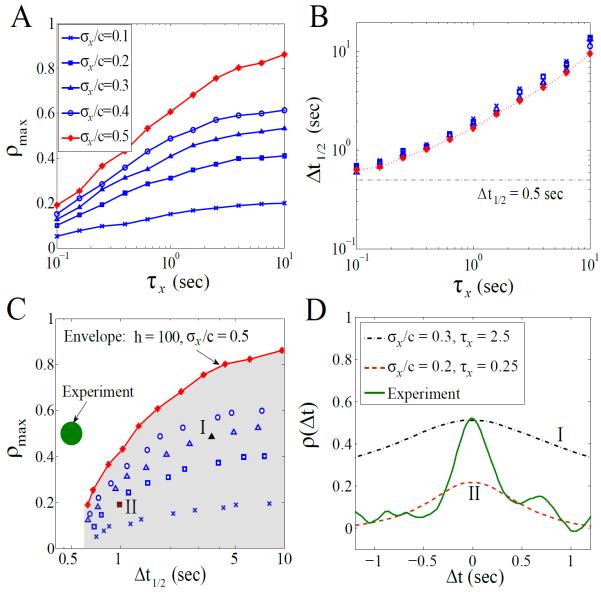
FIG. 2.
(color online). Simulation results for the extrinsic mechanism at c = Kd: (A) ρmax versus τx at different noise levels. The Hill coefficient, h, equals 10.3 for blue symbols and 100 for red symbols. (B) Δt1/2 versus τx for different noise levels. The symbols correspond to those in (A) based on the same simulations. (C) ρtmax and Δt1/2 derived from (A) and (B). The green spot represents the experimental observation which is out of the achievable region (shaded area) of the noise-induced model. (D) ρ(Δt) for the two representative points (I and II) in (C); each is obtained from 20-min simulated traces. The solid line denotes the correlation curve obtained from the 1-min experimental traces [17]; for better comparison, it is shifted to give a 0s-peak in correlation.

