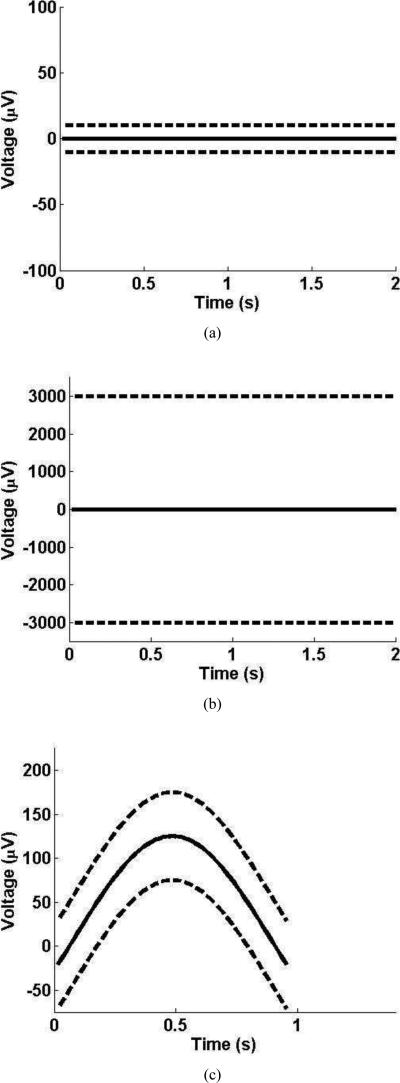
Figure 2.
Examples of patterns from different classes. In each subfigure, the solid line indicates the most probable value of the amplitude and the dashed line indicates the bounds on the amplitude. Figure 2(a) contains the pattern for the interbust interval class. Figure 2(b) contains the pattern for the general activity class. Figure 2(c) contains one example pattern from the delta wave class.

