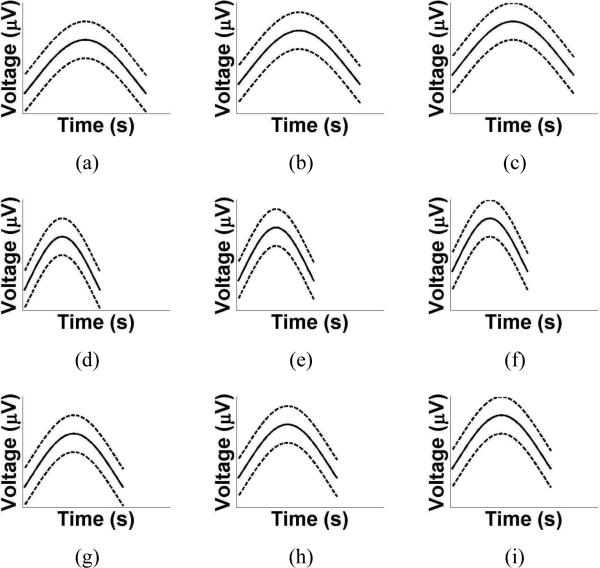
Figure 3.
Examples of patterns from the delta wave class. In each subfigure, the solid line indicates the most probable value of the amplitude and the dashed line indicates the bounds on the amplitude. The patterns differ in their width and vertical offset to model the various morphologies of delta waves.

