Figure 5.
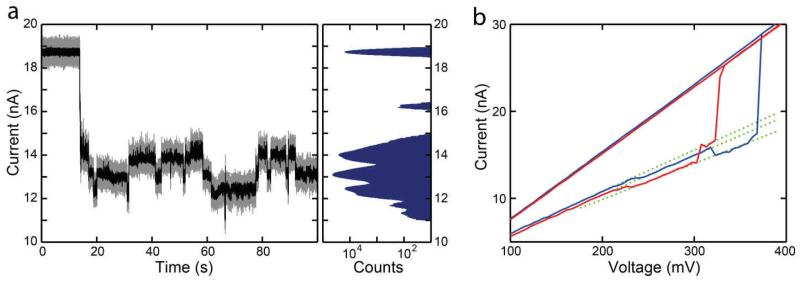
a) Current is seen to jump among a number of discrete levels for a Rothemund rectangle nanoplate docked onto a 20 nm pore at 100mV. The black trace shows data filtered at 20 kHz while the gray data is unfiltered. The histogram on the right shows the frequency of all of the current values in the trace on a log scale, with each peak representing a discrete level. b) IV curve of two different honeycomb nanoplates docked onto the same 10 nm pore. As the voltage is ramped up, the two nanoplates each jump through three distinct levels before being pulled through. Three dotted green lines have been added for visualization purposes.

