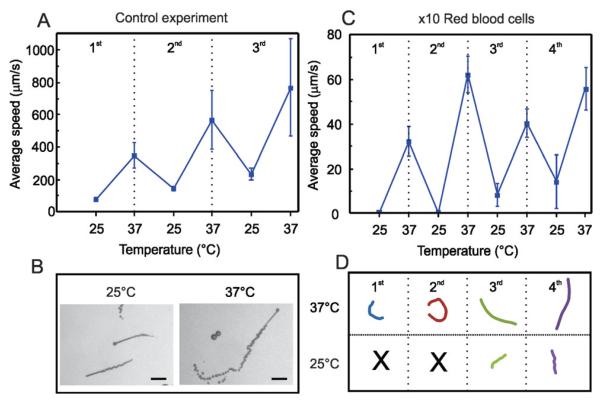
Fig. 2.
Temperature cycles for activation of microjets. A) Motion of microjets in PBS solution. B) Snapshots of microjets and bubble tails at 25 and 37 °C, respectively. Scale bar: 50 μm. C) Motion of microjets in suspensions of red blood cells 10× diluted: average speeds during 4 temperature cycles of 5 min each between 25 and 37 °C. D) Tracked trajectories (4 s) for the 4 cycles of representative microjets.

