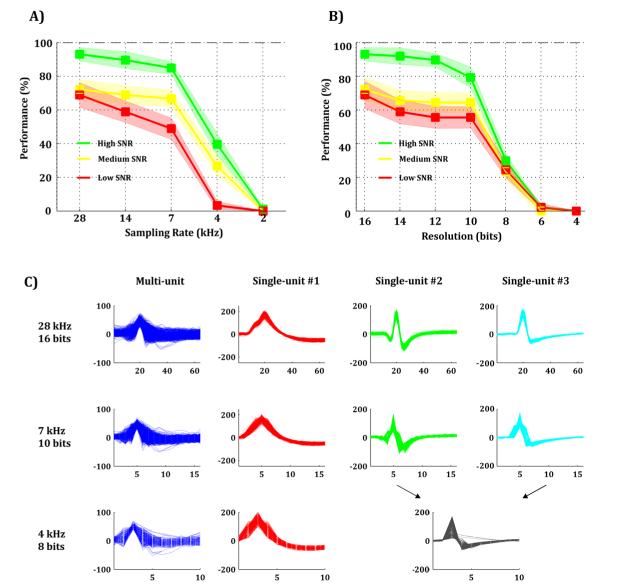
Figure 4. Effect of sampling rate and signal resolution on spike sorting and template building.
A-B) Spike sorting performance for different sampling rates (A) and signal resolutions (B) for high (green), medium (yellow), and low (red) SNRs. C) Illustration of how different clusters (single-unit #2 and #3) are mixed up due to sampling limitations. For this example, a sampling rate of 7 kHz and a signal resolution of 10 bits allow correct identification of the three clusters.

