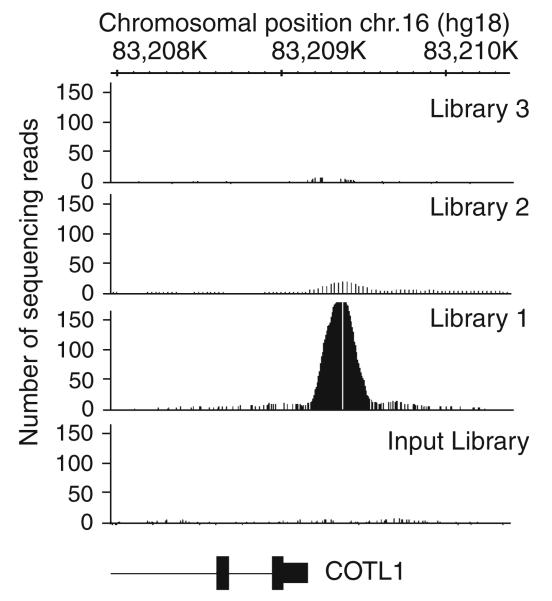
Fig. 27.5.
Comparison of ChIP-seq data. ChIP-seq data from three independent ZNF263 ChIP-seq libraries that were analyzed by qPCR (see Fig. 27.4) and from an input library were visualized using the Integrated Genome Browser. The positive ZNF263 target site (COTL1) is shown. The COTL1 gene is located on chromosome 16. The 5′-end starts at 83,209,170 (shown in the schematic) and the gene extends to the left and ends at 83,156,705 (not shown); all sequences are relative to the hg18 human genome data set on the UCSC browser. Unique sequencing reads (4–5 million) were analyzed for libraries 1–3, and 12 million unique sequencing reads were analyzed for the input library. The peak heights can be compared by the number of sequencing reads plotted on the y-axis. The number of reads observed at the binding site in the COTL1 promoter correlates with the qPCR enrichment data shown in Fig. 27.4.

