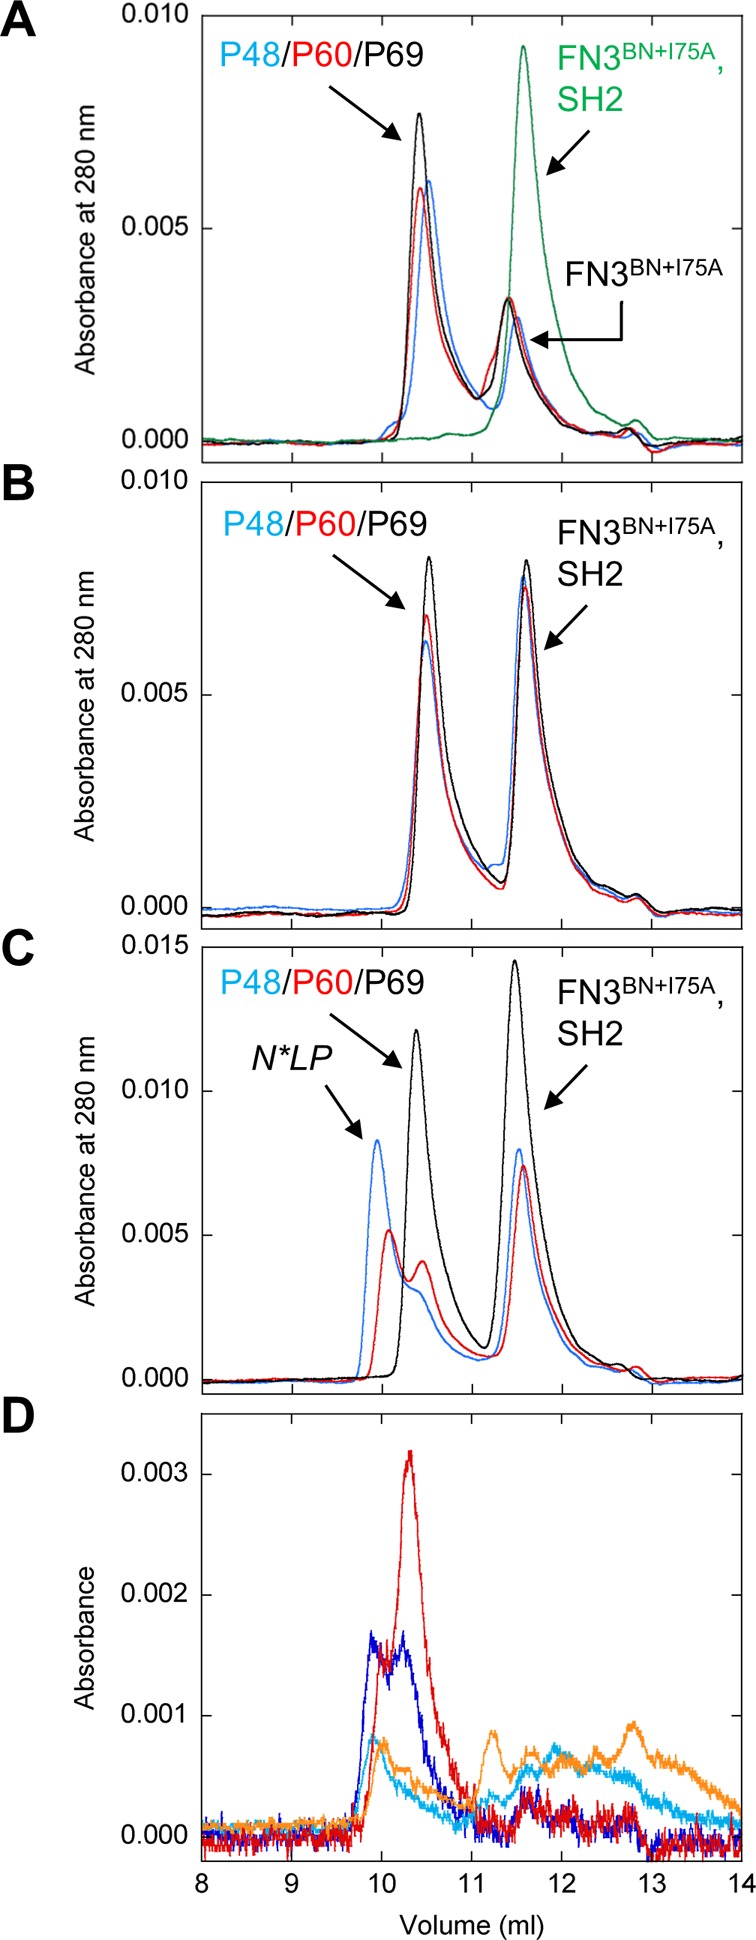
Figure 2.

Binding tests conducted via SEC. (A) The first set of binary complex controls consisted of mixing FN3BN+I75A (5 μM) with P48 (blue), P60 (red), P69 (black), and SH2 (green). Peptide and SH2 concentrations are 5 and 20 μM, respectively. (B) The second set of binary complex controls consisted of mixing SH2 with P48 (blue), P60 (red), and P69 (black). (C) Ternary complex formation was tested by mixing FN3BN+I75A, SH2, and P48 (blue), P60 (red), or P69 (black). (D) Components of the N*PL complexes were identified by repeating the experiment in panel C using FN3BN+I75A labeled with Alexa594 and P48/P60 labeled with Alexa488. The chromatogram of the P48-containing sample is shown with absorbance detection at 488 nm (dark blue) and 594 nm (cyan). The chromatogram of the P60-containing sample is shown with absorbance detection at 488 nm (red) and 594 nm (orange).
