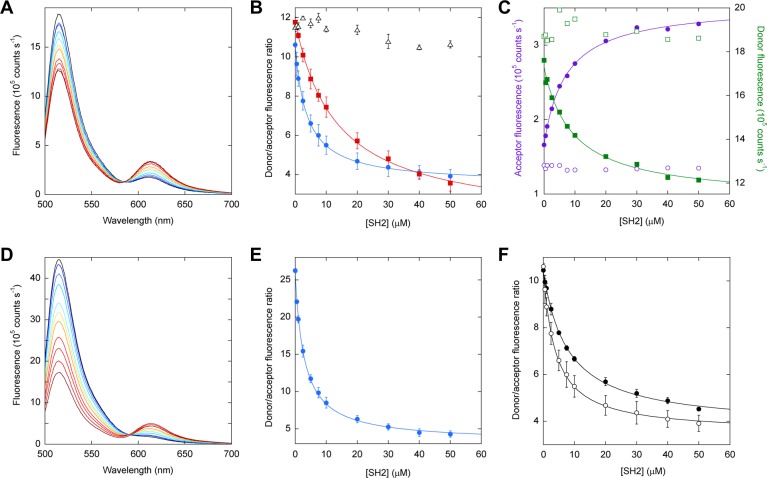
Figure 3.
SH2 binding to FREX sensors monitored by FRET. FN3BN+I75A is labeled with the donor at the N-terminus in panels A–C and F. FN3BN+I75A is labeled with the donor at Cys48 in panels D and E. (A) Unprocessed spectra of donor-labeled FN3BN+I75A (2 μM) and acceptor-labeled P48 (2 μM) are overlaid to show ratiometric changes in fluorescence intensity as a function of increasing SH2 concentration, from 0 (black) to 50 μM SH2 (dark red). (B) Dependence of FRET ratio on SH2 concentration plotted for the P48 (blue circles), P60 (red squares), and P69 (black triangles) sensors. Lines are best fits of the data to the one-site binding equation. Error bars are standard deviations of triplicate experiments. (C) Donor emission at 519 nm (filled green squares) and acceptor emission at 617 nm (filled purple circles), obtained from spectra in panel A, plotted as a function of SH2 concentration. When acceptor-labeled P48 is mixed with unlabeled FN3BN+I75A, the acceptor fluorescence does not increase with SH2 concentration (empty purple circles). Similarly, when donor-labeled FN3BN+I75A is mixed with unlabeled P48, the donor emission does not decrease with SH2 concentration (empty green squares). (D) Unprocessed spectra of donor-labeled FN3BN+I75A and acceptor-labeled P48 are superimposed to show the increase in FRET efficiency resulting from moving the donor to position 48 of FN3BN+I75A from the N-terminus (cf. panel A). SH2 concentrations are identical to those in panel A. (E) The ratiometric output of the P48 sensor (calculated from spectra in panel D) improves when the donor is moved to position 48 of FN3BN+I75A from the N-terminus (cf. panel B). (F) The performance of the P48 sensor in 10% (v/v) fetal bovine serum (●) is comparable to that in buffer (○). Error bars are standard deviations of triplicate measurements.

