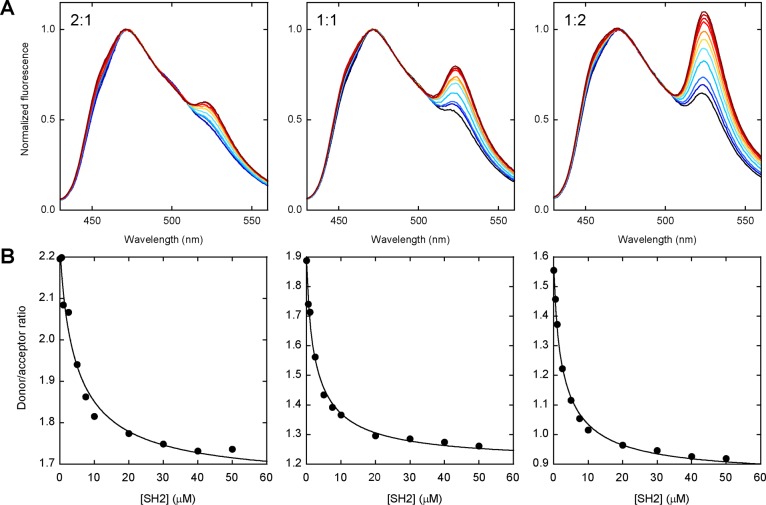
Figure 4.
Performance of the genetically encoded P48 sensor in unpurified E. coli lysate. (A) Spectra of CyPet-FN3BN+I75A and YPet-P48 as a function of SH2 concentration. Approximate molar ratios of CyPet-FN3BN+I75A to YPet-P48 are indicated in each figure. Colors and SH2 concentrations are the same as in Figure 3A. Spectra are normalized to the donor emission peak for the sake of clarity. (B) Binding curves are shown below each figure in panel A. Lines are the best fits of the data to the one-site binding equation; fitted parameters are listed in Table 1.

