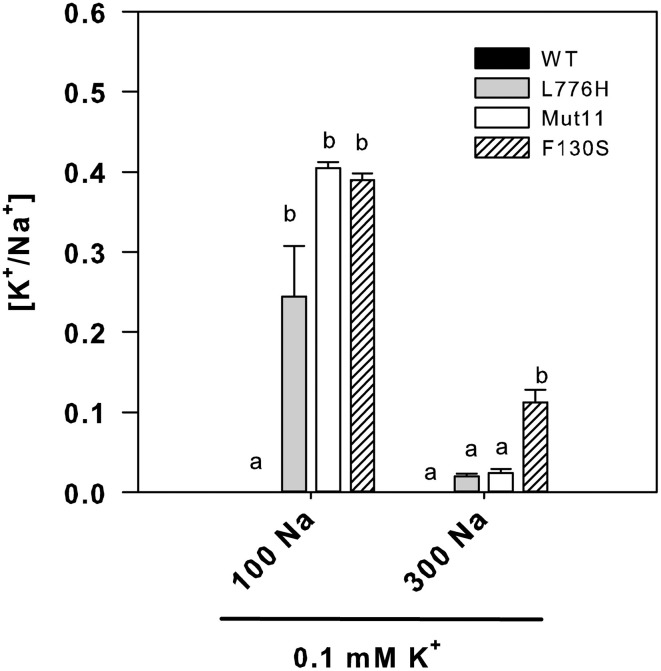
Figure 3.
Internal K+/Na+ ratios of 9.3 yeast cells expressing WT AtHAK5 and mutated AtHAK5 K+ transporters. Cells were treated and analyzed as indicated in Figure 2. Shown are the ratios of internal K+/Na+ concentrations of the cells grown in the presence of 0.1 mM K+ at 100 or 300 mM Na+. Reported values are the average of at least 6 replicates and error bars denote standard error. Columns with different letters within each ionic treatment are significantly different according to Tukey test (p < 0.05).

