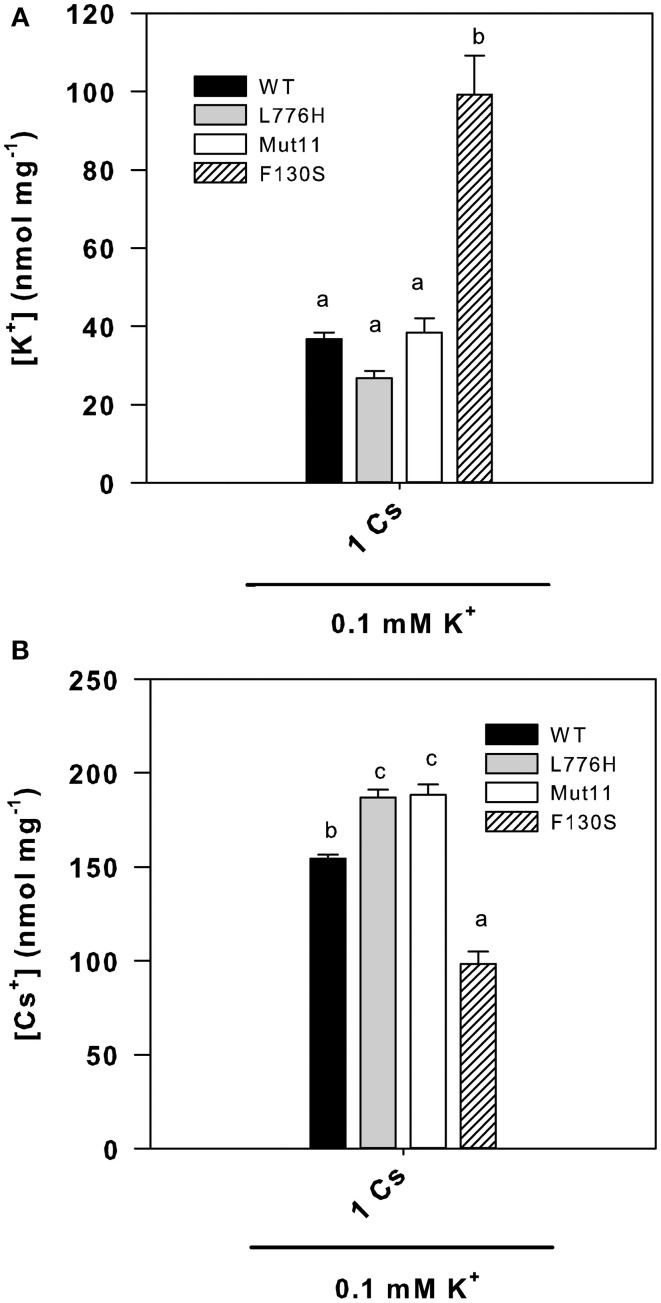
Figure 4.
Internal K+ and Cs+ concentrations of 9.3 yeast cells expressing WT AtHAK5 and mutated AtHAK5 K+ transporters. The same strains described in Figure 1 were grown for 24 h in minimal AP liquid media supplemented with 0.1 mM K+ and 1 mM Cs+. After 24 h cells were collected by filtration and their ionic content was acid extracted. The K+ and Cs+ concentrations in the acid extracts were determined by atomic emission spectrometry and the internal K+ and Cs+ concentrations calculated on a dry weight basis. Shown are averages of internal K+ (A) and Cs+ (B) concentrations of at least 6 replicates and error bars denote standard error. Columns with different letters within each ionic treatment are significant different according to Tukey test (p < 0.01).

