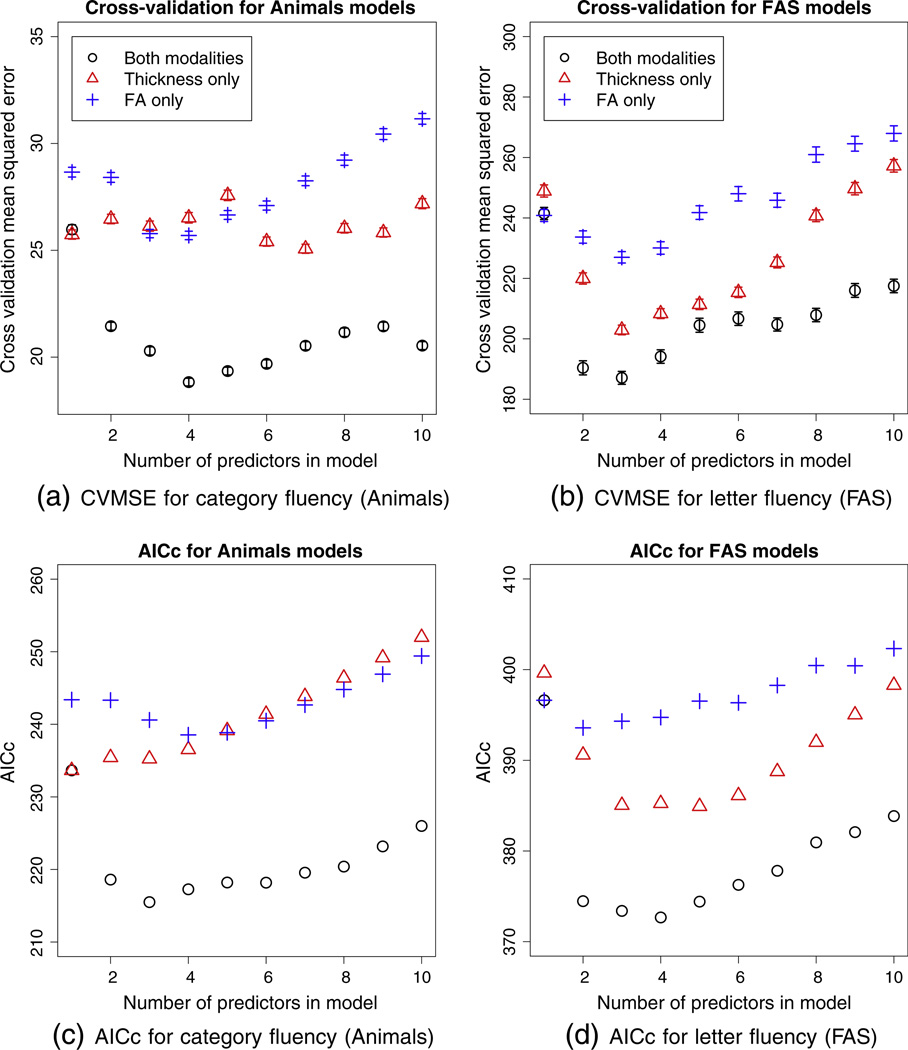
Fig. 3.
Top row: mean squared error for Monte Carlo cross-validation of the sparse regression models, with 18 subjects left out Points are the average mean squared error over 5000 folds, vertical bars are 95% confidence intervals on the mean values. Bottom row: AICc scores for the same regression models. The legend follows that of the top row.

