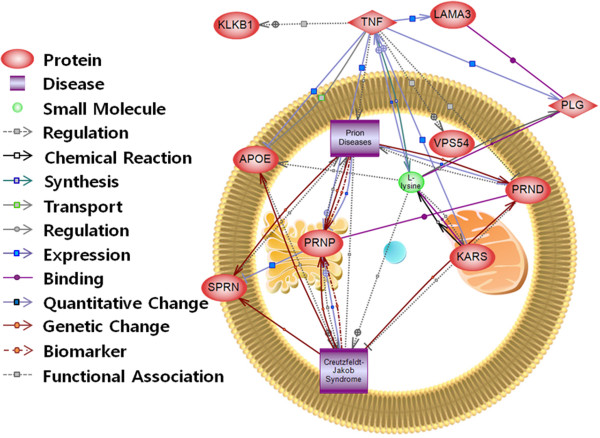
Figure 2.

Interaction network using Pathway studio. Interactions between nodes are denoted by coloured arrows or lines. Seed nodes are marked as red circles. PLG and TNF are shown as significant interactions with the seed nodes, PRNP, prion diseases were marked as diamond-square.
