
Figure 4.
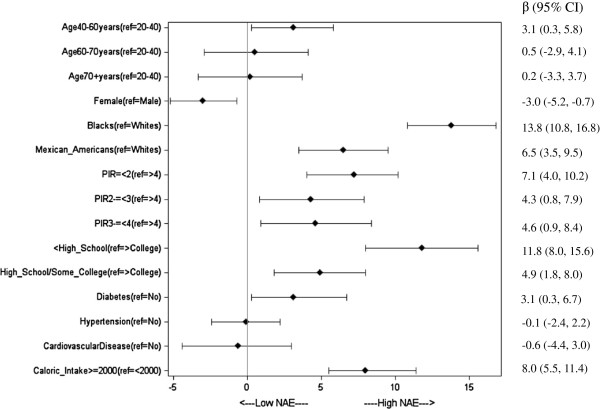
Association of NHANES (1999–2004) Participant Characteristics with estimated Net Acid Excretion (NAE). The graph shows adjusted beta coefficients, from quintile (median) regression. Points show beta coefficients per quintile, and bars show 95% confidence intervals. Reference groups (Dots on the vertical line = 0) are not shown for clarity.