
Figure 1.
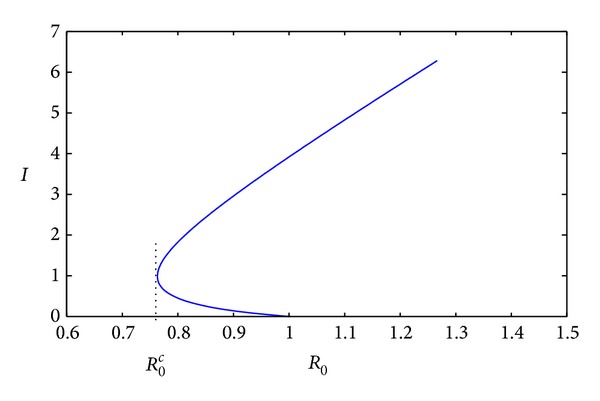
The figure of infective sizes at equilibria versus R 0 when β = 0.05, ε = 1.2, d = 0.2, μ = 0.2, υ = 0.4, r = 1.5, α = 0.1, and k = 2, where k is big enough to lead a backward bifurcation with two endemic equilibria when R 0 c < R 0 < 1.
Official websites use .gov
A
.gov website belongs to an official
government organization in the United States.
Secure .gov websites use HTTPS
A lock (
) or https:// means you've safely
connected to the .gov website. Share sensitive
information only on official, secure websites.
The figure of infective sizes at equilibria versus R 0 when β = 0.05, ε = 1.2, d = 0.2, μ = 0.2, υ = 0.4, r = 1.5, α = 0.1, and k = 2, where k is big enough to lead a backward bifurcation with two endemic equilibria when R 0 c < R 0 < 1.