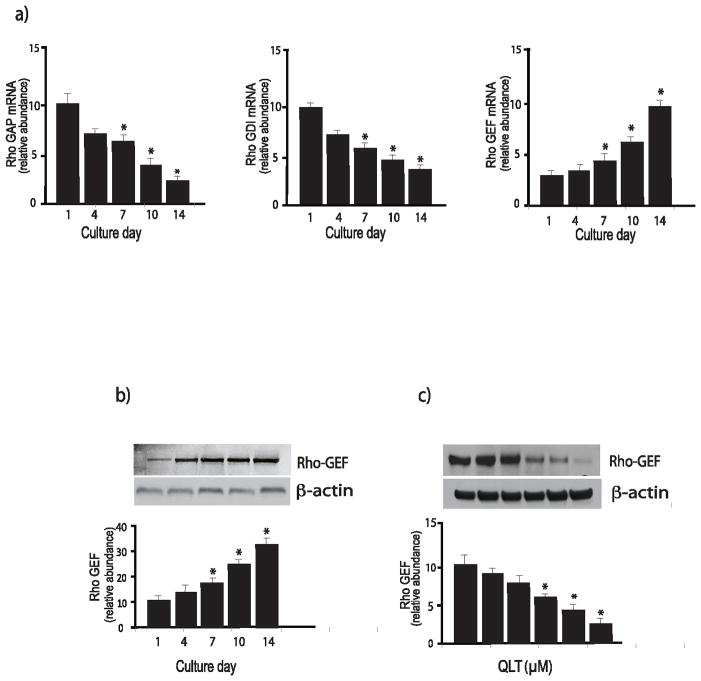
Figure 5. Regulation of Rho proteins during stellate cell activation.
In (a), stellate cells were isolated from the livers of normal rats as in Methods and were allowed to undergo spontaneous culture induced activation for the indicated number of days. Rho GAP (left), Rho GDI (center), and Rho GEF (right) mRNA were measured by RT-PCR as in Methods and the data presented graphically (n=3, *p<0.05, compared to the level for day 1). In (b), stellate cells as above were subjected to immunoblotting (50 μg of total protein) with anti-Rho-GEF antibody. A representative immunoblot is shown in the upper panel, and below it, a stripped blot re-probed for β-actin; subsequently, specific bands were quantified, normalized to the signal for β-actin and the data presented graphically below (n = 5; *p<0.05, compared with the signal for day 1). In (c), cells were allowed to grow for 6 days, and cells were exposed to the indicated concentrations of QLT-0267 in medium containing 0.1% serum for 18 hours. Lysates were harvested and RhoGEF was detected by immunoblotting as in Methods. Signals were scanned, normalized to the control value, and displayed in the graph below the immunoblot (n=3, *p<0.05, compared to control - without QLT).

