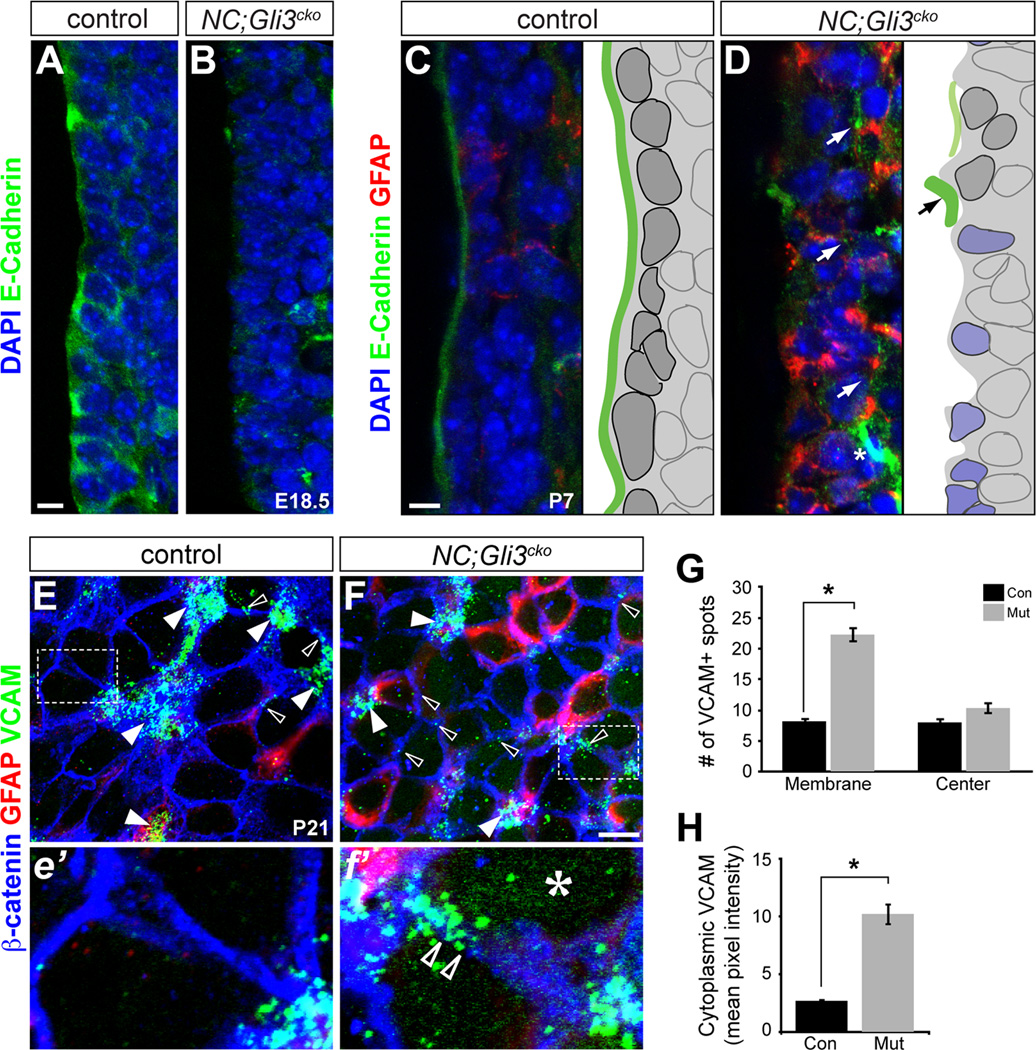
Figure 5. Distribution of adhesion molecules is disrupted in NC;Gli3cko.
(A and B) E-Cadherin protein (green) is highly expressed at the apical surface of RGCs in the control mice at E18.5 (A), but is reduced at the apical surface in NC;Gli3cko mutants (B). Scale bar, 10µm.
(C and D) E-Cadherin protein (green) is expressed just at the ventricular surface by ependymal cells at P7 in control mice (C). NC;Gli3cko mice show reduced E-Cadherin expression and increased GFAP (red) compared to the control (D). Schematics of immunohistochemical results shown to the right of each image. Dark gray cells represent ependymal cells. Blue cells represent atypical mutant cells. Green lines represent E-Cadherin lining. Scale bars, 10µm.
(E and F) Whole mount immunohistochemical staining of the ventricular surface at P21 reveals VCAM1 (green) protein localization in NC;Gli3cko (F, f’) versus controls (E, e’). Higher magnification of inset is shown below low magnification images (e’, f’). GFAP (red) marks NSC. Open arrowheads show membrane localization of VCAM that is not associated with NSC clusters. White arrowheads show VCAM staining clustered at pinwheel centers. The asterisk (f’) shows the upregulation of VCAM in the cytoplasm of mutant cells. Scale bar in (E and F), 10µm.
(G) Quantification of VCAM spots. 10–15 images for each genotype were counted. Areas of staining above background were considered a VCAM+ spot. If the cluster was at the center of a pinwheel, it was deemed a “cluster” spot, and if at the membrane between two cells a “membrane” spot. All were normalized to spots/image. There were significantly more spots at the membrane of mutant animals as compared to controls. Error bars represent S.E.M. *, p < 0.05.
(H) Quantification of cytoplasmic VCAM staining. ImageJ was used to quantify VCAM pixel intensity for each image using a filter based on β-catenin staining to remove VCAM staining localized to the membrane. The mutant images had significantly increased cytoplasmic VCAM as compared to the controls. Error bars represent S.E.M. *, p < 0.05. See also Figure S4.

