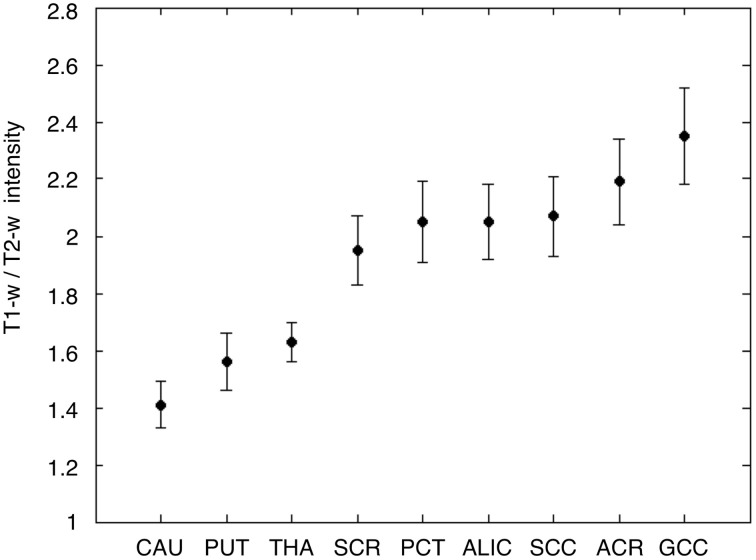
Figure 11.
T1-w/T2-w intensities in gray and white matter ROIs. Average and standard deviation of T1-w/T2-w values are shown for the nine selected ROIs, three in the gray matter, and six in the white matter. As expected, T1-w/T2-w values were lower in the gray matter and in the white matter. The ROIs are labeled as follows: caudate nucleus (CAU), putamen (PUT), thalamus (THA), superior corona radiata (SCR), pontine crossing tract (PCT), anterior limb of internal capsule (ALIC), splenium of corpus callosum (SCC), anterior corona radiata (ACR), and genu of corpus callosum (GCC).

