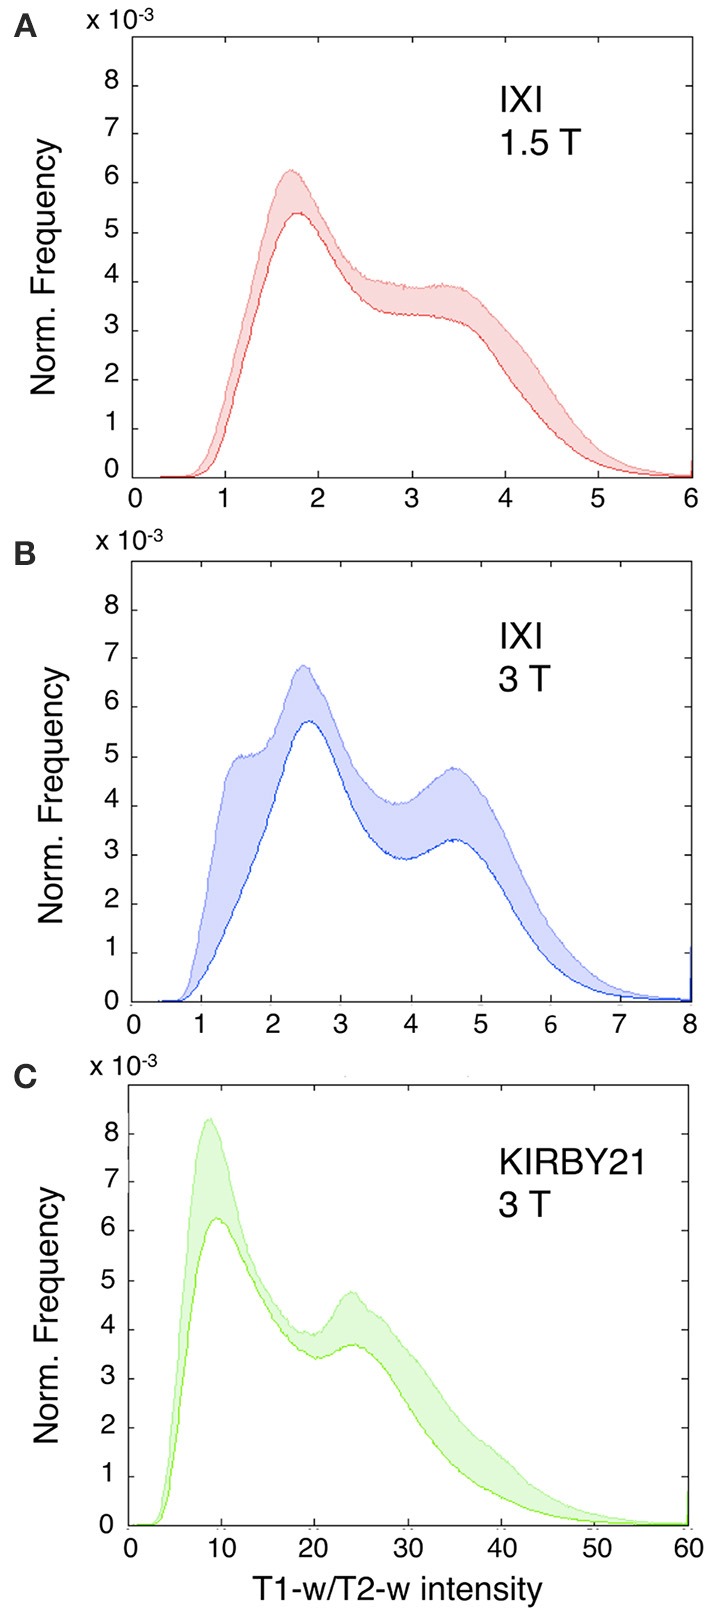
Figure 5.

Histograms of T1-w/T2-w image intensities before calibration. Mean T1-w/T2-w histograms (with standard deviation in colored shade) are presented for the IXI 1.5 T (A), IXI 3 T (B), and KIRBY21 3 T (C) datasets. The three datasets have inconsistent T1-w/T2-w intensity values. (A) IXI 1.5 T dataset shows a relatively large inter-subject reproducibility with the smallest extent of standard deviation. (B) IXI 3 T dataset displays a similar trend with an increased standard deviation in correspondence to the gray matter peak. (C) KIRBY21 3 T dataset exhibits the greatest inter-subject variability especially in the right tail of the histogram.
