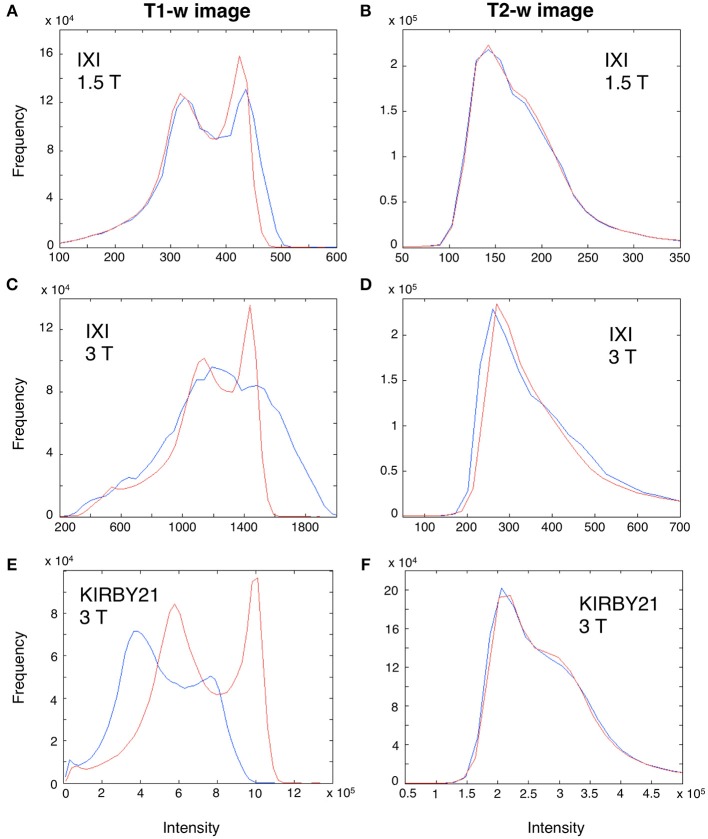
Figure 6.
Effect of bias correction on T1-w and T2-w images. A modality-dependent bias correction procedure was performed for both T1-w and T2-w. To illustrate the relative results, we analyzed the T1-w (A,C,E) and T2-w histogram (B,D,F) of three representative subjects from the IXI 1.5 T (Subject 002), IXI 3 T (Subject 093) and KIRBY21 (Subject 30) databases, respectively. Specifically, we compared the histograms before (blue line) and after bias-correction (red line). Before correction, the T1-w image of IXI 1.5 T dataset (A) was less biased than the IXI 3 T (C) and the KIRBY21 3 T (E), with an average correlation of r = 0.73. After bias correction, this correlation increased to r = 0.89. Conversely, in the T2-w image minor changes were observed, with an average correlation between histograms being r = 0.96 and r = 0.97 before and after bias correction, respectively.

