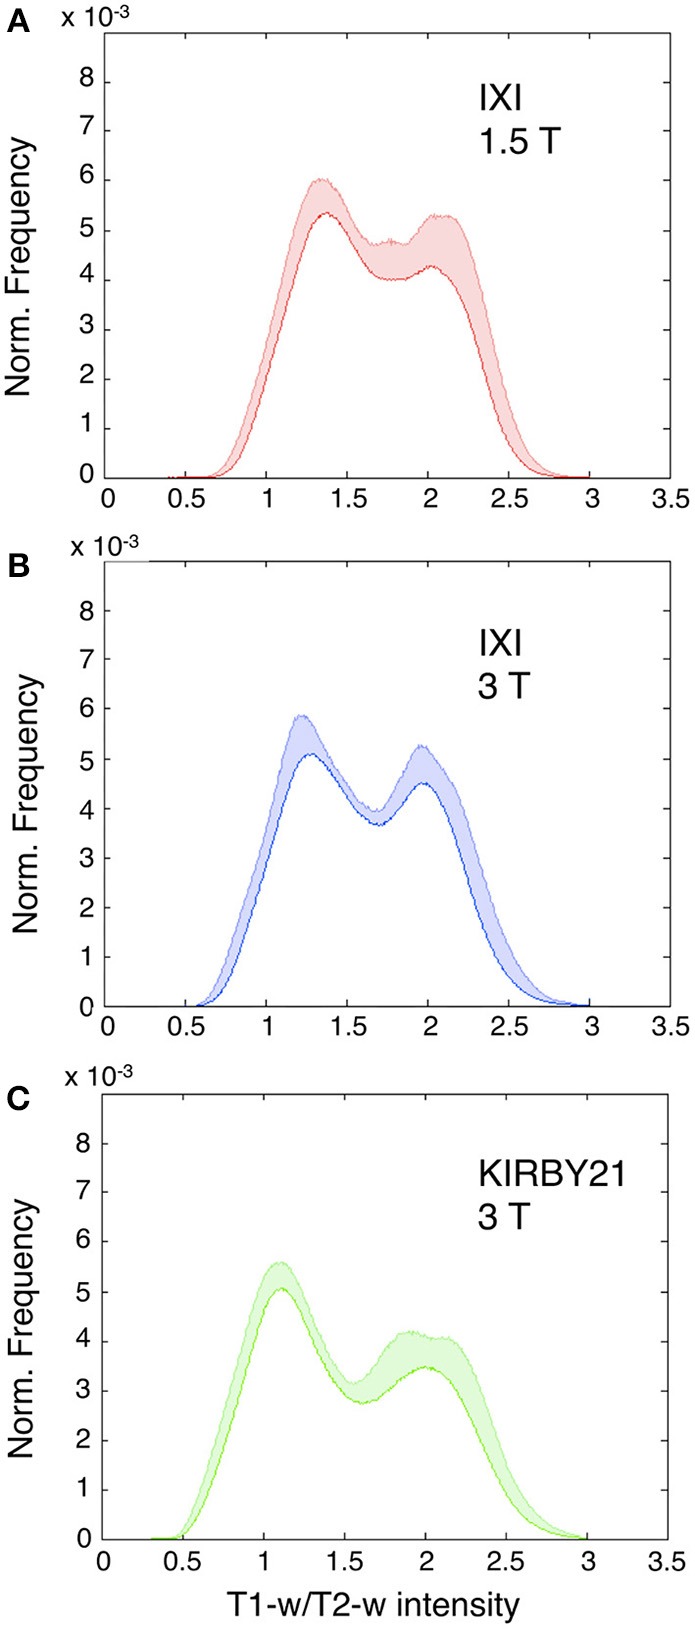
Figure 7.

Histograms of intensities in calibrated T1-w/T2-w images. Mean T1-w/T2-w histograms (with standard deviation in colored shade) are presented for the IXI 1.5 T (A), IXI 3 T (B), and KIRBY21 3 T (C) datasets. In agreement with the scaling algorithm, the calibrated T1-w/T2-w images exhibit comparable intensity scales with a reduced inter-subject variability for each dataset. Note the normalized frequency on the vertical scale obtained as the ratio of each subject-specific histogram to the total area beneath the curve.
