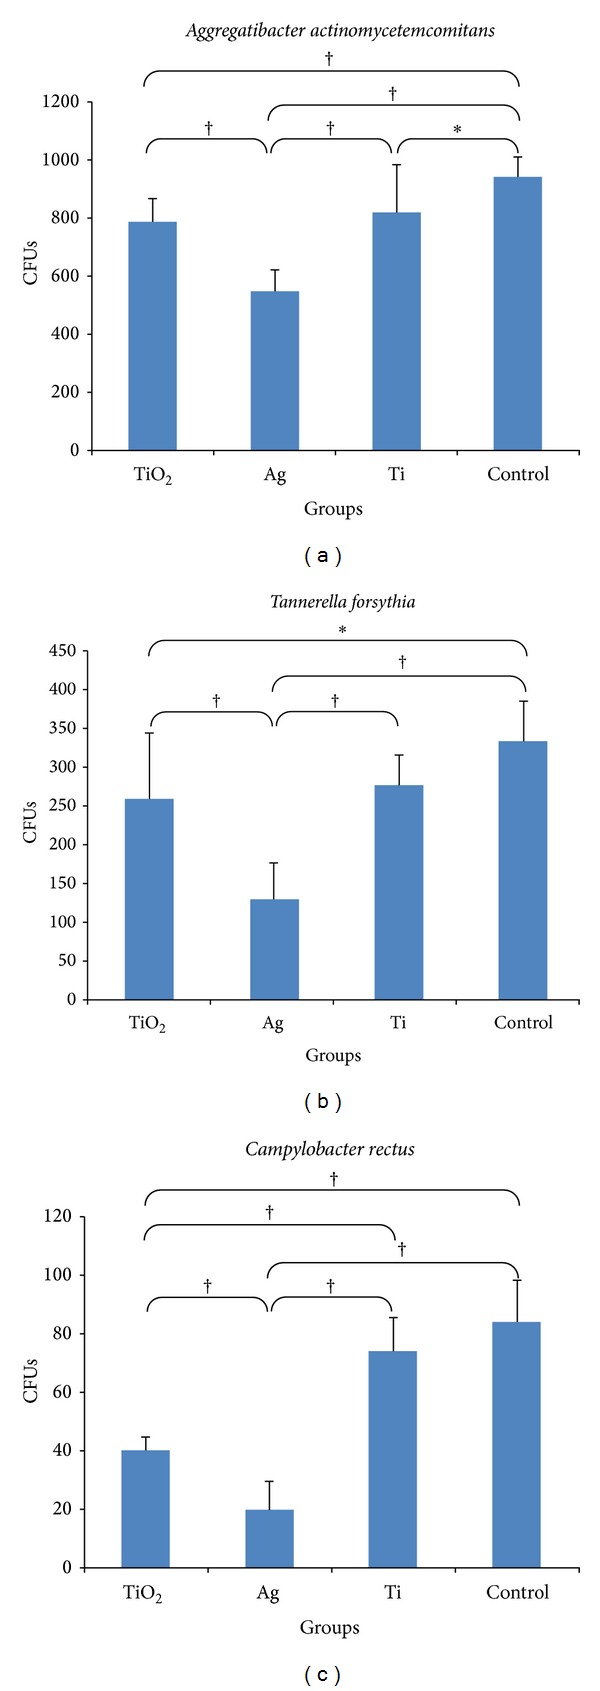
Figure 3.

Descriptive analysis of adhesion of (a) A. actinomycetemcomitans, (b) T. forsythia, and (c) C. rectus on all groups tested (Group TiO2: as-annealed TiO2 nanotubes; Group Ag: as-annealed Ag doped TiO2 nanotubes; Group Ti: commercially pure Ti sheet; Control Group: 24-well cell culture plate bottoms). Data are presented as the mean ± SD (standard deviation). Results were analyzed using a one-way ANOVA and post hoc analyses were performed using Tukey's studentized range (HSD) test (*P < 0.05 and † P < 0.01).
