Figure 1.
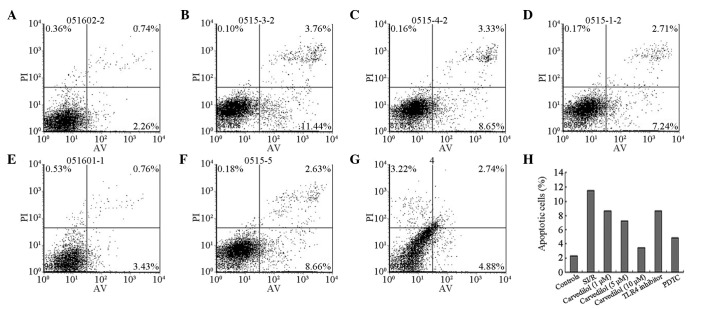
Flow-cytometric analysis was performed to detect the apoptotic rate of H9c2 cardiomyocytes under different treatments following simulated ischemia/reperfusion (SI/R) injury. The apoptosis rate was measured by Annexin V-fluorescein isothiocyanate (FITC)/propidium iodide (PI) dual staining cytometry. The upper right region shows the late apoptotic cells (FITC+/PI+); the lower left region shows the intact cells (FITC−/PI−) and; the lower right region shows the early apoptotic cells (FITC+/PI−). Data are presented as mean ± standard deviation. (A) Control; (B) SI/R; (C) carvedilol (1 μM); (D) carvedilol (5 μM); (E) carvedilol (10 μM); (F) toll-like receptor 4 (TLR4) inhibitor and; (G) pyrrolidine dithiocarbamate (PDTC; NF-κB inhibitor) groups. (H) Percentage of apoptotic cells in the various groups.* P<0.01 compared with control group; ** P<0.05 compared with SI/R group; #P<0.01 compared with SI/R group.

