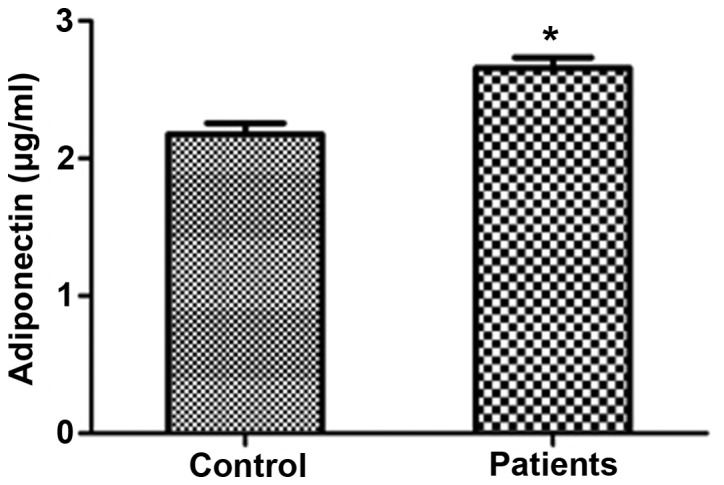
Figure 1.

Adiponectin levels in the control and patient groups. Data are presented as the mean ± standard error of the mean. A significant difference in the adiponectin levels was found between the two groups. *Indicates significant difference (P<0.01) from the control group.
