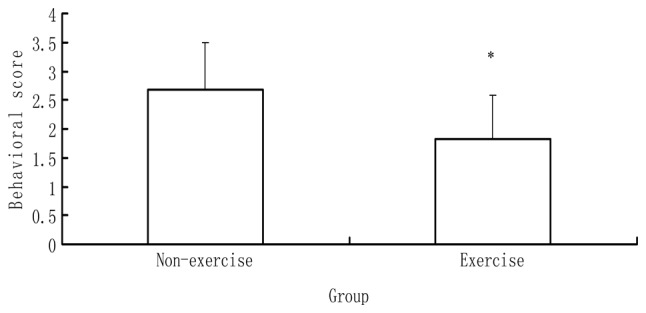
Figure 1.

Behavioral scores of the MCAO with and without exercise groups. Data are presented as the mean ± standard deviation (n=6). The behavioral scores for the sham group were all zero (data not shown). *P<0.05 vs. the MCAO without exercise group. MCAO, middle cerebral artery occlusion.
