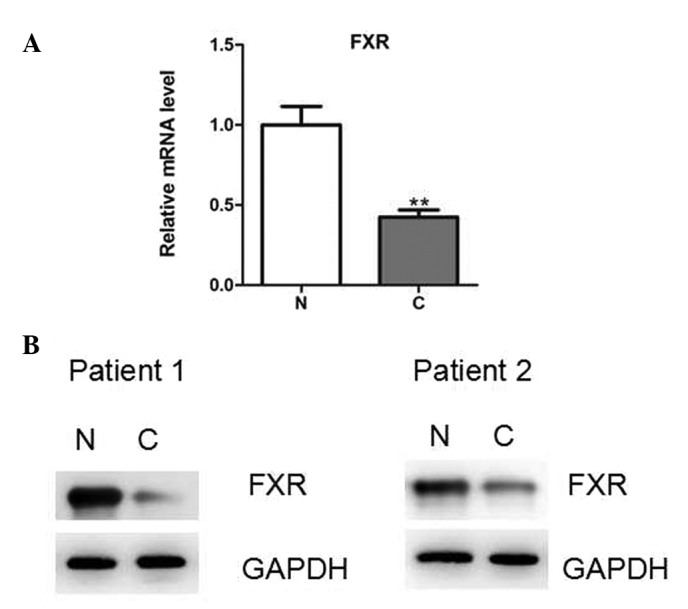
Figure 4.

FXR expression levels in prostate cancer tissues. FXR expression levels were determined by (A) quantitative PCR and (B) representative western blot analysis in 25 pairs of human prostate cancer tissues and adjacent noncancerous tissues. FXR, farnesoid X receptor; PCR, polymerase chain reaction; C, cancer tissues; N, noncancerous tissues.
