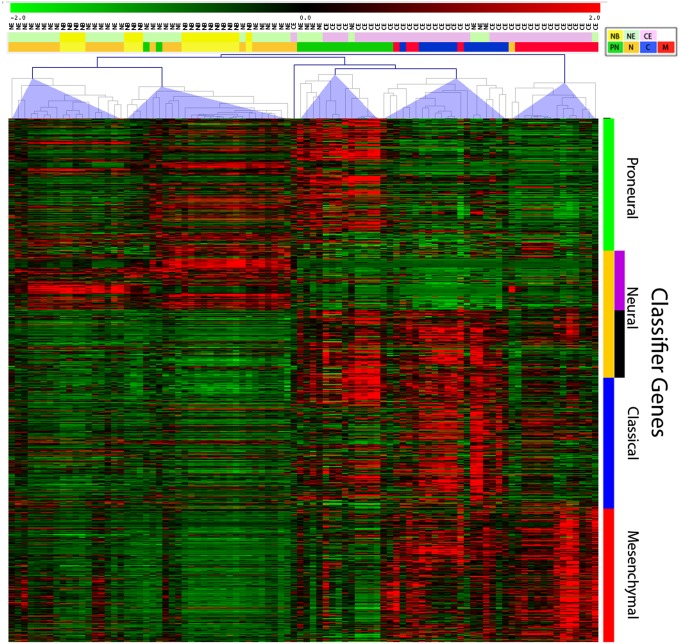
Fig. 2.
RNA-seq–based expression profiling showing the expression of the Verhaak classifier genes across 92 samples (39 CE, 36 NE, and 17 NB). The samples were clustered by using Spearman correlation into five major clusters. Two clusters are predominantly composed of NE and NB samples, and the other three clusters are predominantly composed of CE samples, with samples correlating with proneural, classical, and mesenchymal subtypes. The NE clusters contain the majority of neural samples. The colored bars above the heatmap show the sample origin (upper bar: NB, yellow; NE, green; CE, pink) and the subtype classification (lower bar: neural, brown; proneural, green; classical, blue; mesenchymal, red). The heatmap shows high levels of expression as red and low levels as green.

