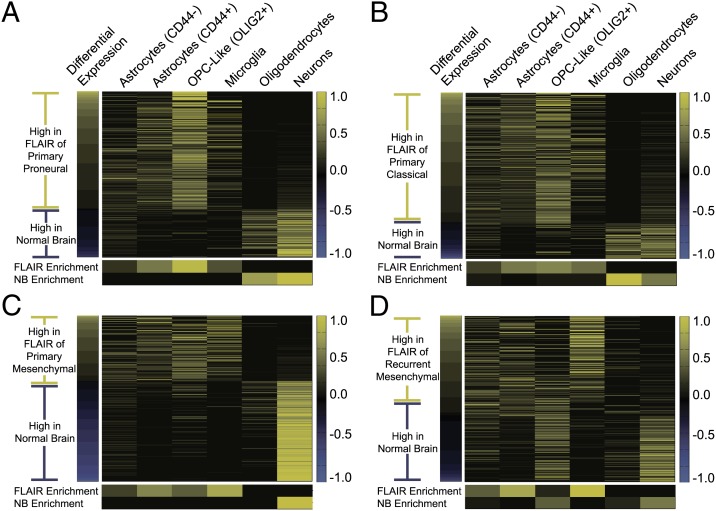
Fig. 4.
Heatmaps showing the deconvolved cellular distribution of gene expression for differentially expressed genes (P < 0.05) comparing normal brain (NB) to NE of proneural GBMs (A), NE of classical GBMs (B), NE of Primary mesenchymal GBMs (C), and NE of Recurrent mesenchymal GBMs (D). For each gene (rows), the expression level is normalized across cell types (columns) so that the value in the heat map reflects its fractional abundance in a given cell type. To obtain these cellular distributions, we deconvolved the NE and NB samples in aggregate and obtained a single average cellular distribution estimate for each gene. Although differential expression information was not provided to the deconvolution algorithm, all four heatmaps show a sharp transition in cellular composition between genes that are expressed at higher levels in the NE tumor tissue vs. genes that are expressed at higher levels in normal brain. The small heat maps that appear underneath each image represent the fraction of the total number of differentially expressed genes in each sample group are predominantly expressed in each of the six cell types.

