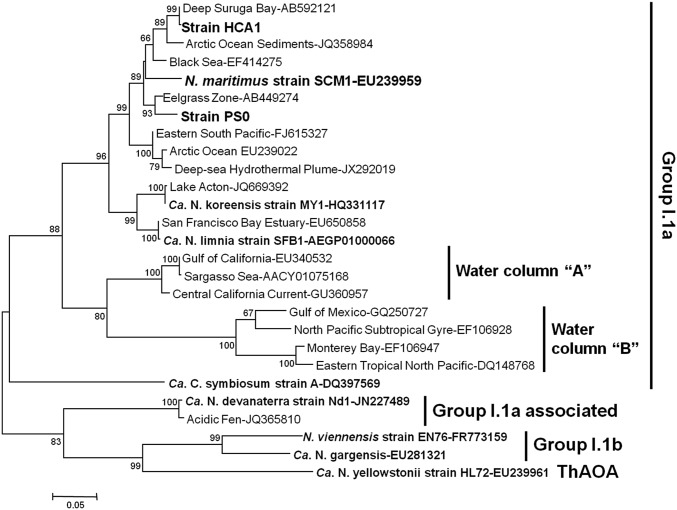
Fig. 2.
Phylogenetic relationships among amoA gene sequences of strains HCA1, PS0, and SCM1 and described AOA representatives, as well as relevant environmental clone sequences. The tree was constructed using the maximum-likelihood method with Kimura two-parameter correction. Confidence values were based on 1,000 bootstrap replications. (Scale bar represents 0.05 nucleotide changes per position.)

