Fig. 1.
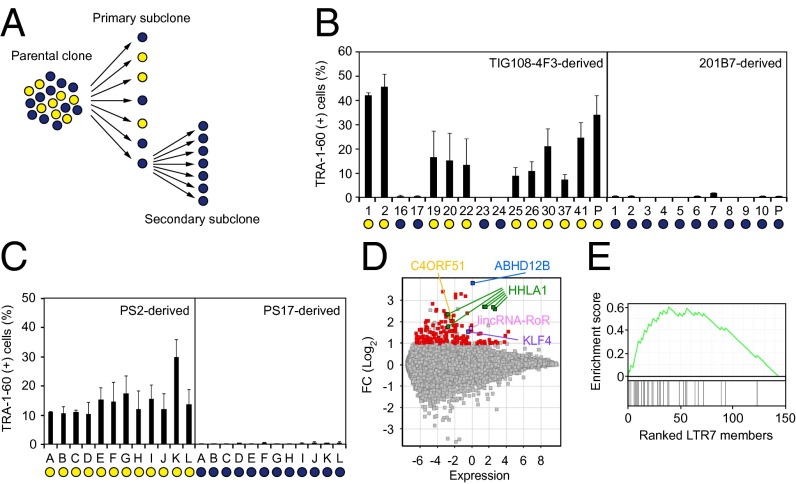
Enrichment of LTR7s in subcloned DD-iPSCs. (A) Summary of single-cell subcloning. (B) Differentiation potential of primary subclones. Shown are the percentages of TRA-1-60 (+) cells 14 d after neural induction of each primary subclone analyzed by flow cytometry. Blue and yellow circles indicate normal and DD-iPSC subclones/parents, respectively. n = 3. Error bars are SDs. (C) Differentiation potential of secondary subclones. Shown are the percentages of TRA-1-60 (+) cells 14 d after neural induction of TIG108-4F3-PS2- and PS17-derived secondary subclones. Blue and yellow circles indicate normal and DD-iPSC subclones, respectively. n = 3. Error bars are SDs. (D) Differential expression of genes between normal and DD-iPSCs. MA plot comparing global gene expression in normal (n = 18) and DD (n = 37) primary subclones derived from four DD-iPSCs parental clones (TIG108-4F3, TIG118-4F1, 451F3, and TKCBV5-6). Red and colored dots indicate genes with significantly higher expression in DD-iPSCs (FC > 2, FDR < 0.05). (E) Correlation between DD-marker expression and the presence of LTR7 elements. GSEA plot showing enrichment of LTR7 elements in 144 DD-iPSC markers. DD-iPSC markers are displayed in order of their fold-changes between normal- (n = 18) and DD- (n = 37) iPSC subclones in expression levels determined by a microarray.

